The old investing adage “sell in May and go away” may not always hold true to the exact month, but as we enter the dog days of summer, sector rotation is showing up on seasonal cue. Today I'll be focusing on consumer staple and telecom stocks which consistently outperform the TSX index between the months of May and October. If you are a frequent visitor to my website, you'll notice that I've been featuring many of the following stocks over the last few weeks as they began to issue a momentum alert to signal their breakout.
Consumer Staples
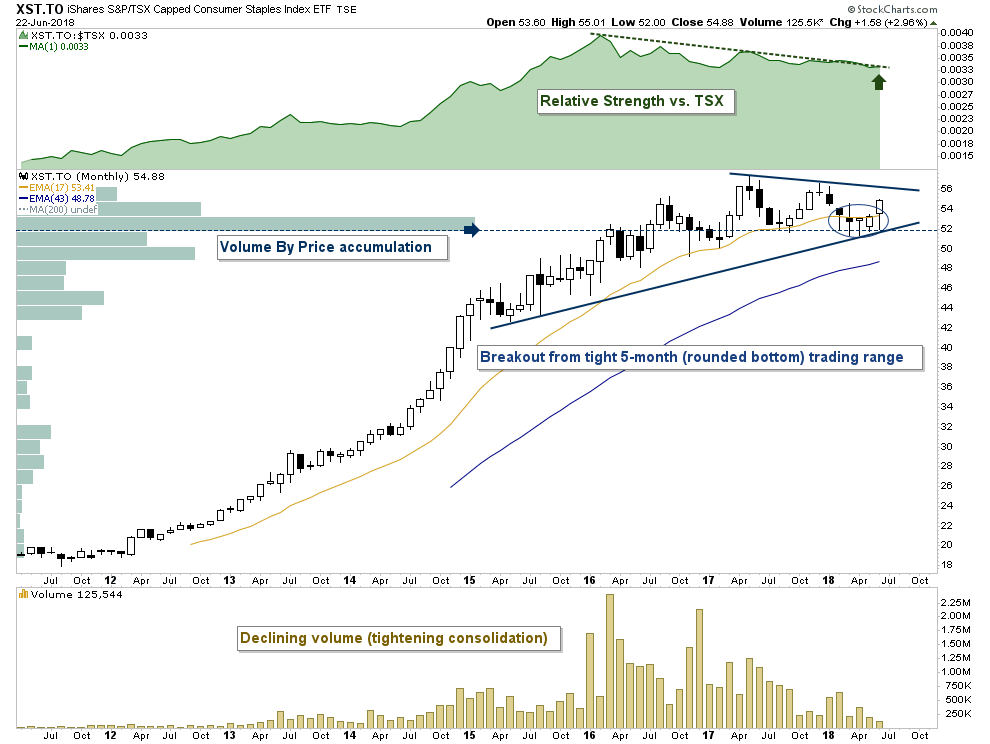
Below is a monthly chart of the
TSX Consumer Staples ETF (TSX:XST), where each candle represents one month. Each candle doesn't become valid until the end of the month. For demonstrational purposes, this chart is setting up perfectly. Over the last three and a half years, price action has been building a massive symmetrical triangle continuation pattern which coincides with a major volume by price accumulation bar. What has me excited is the tight trading range of bullish candles that have formed a rounded bottom pattern during the last 5-months. This bullish price action is being confirmed by volume.
Technically, as a symmetrical triangle develops and the trading range contracts, volume should start to decline. This refers to the calm before the storm, or the tightening consolidation before the breakout. As I often point out, periods of low volatility are often followed by high volatility.
Here are the top 10 holdings of the Consumer Staples ETF. Each name is currently appearing on the momentum alert scanner and are technically set up to propel the ETF higher.
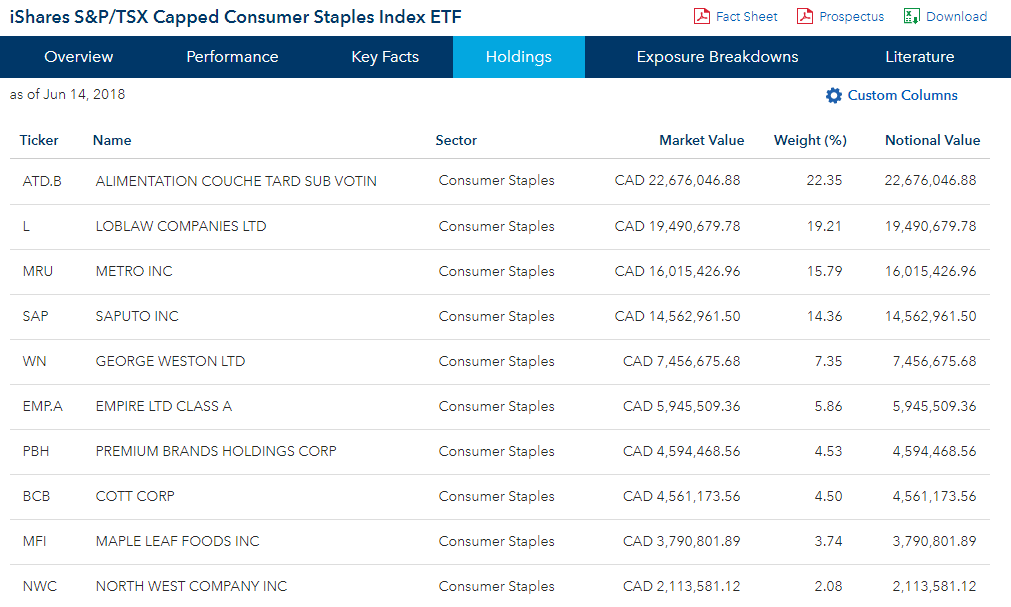
Today I'll be zooming in on 5 charts from these top 10 holdings. Pay close attention to the relative strength indicator vs. the TSX composite. The relative strength indicator is used to compare the performance of a stock vs. a benchmark such as the TSX. Each of the following charts are poised to breakout in relative strength. A breakout in relative strength would signal outperformance. Since it's each fund managers' goal to outperform the market, this would cause an acceleration of institutional led money to rotate into the sector creating an acceleration of momentum in each name.
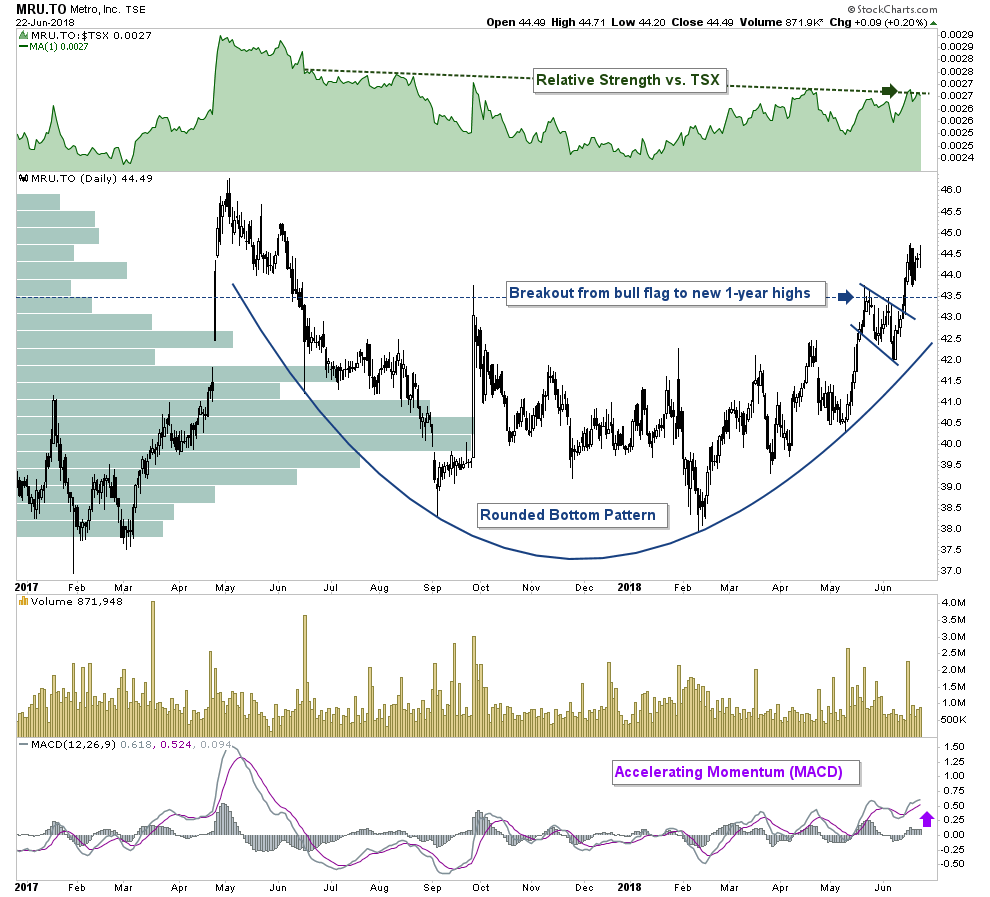
Metro (TSX:MRU) - Daily Chart
Metro has been consolidating within a massive 13+ month bullish rounded bottom pattern. Price action recently broke out from a bull flag pattern to new 1 year highs. With relative strength vs. the TSX poised to breakout above a mulit-month downtrend line, this price action is very bullish and suggests more upside to come. The next area of resistance is at approximately $46.
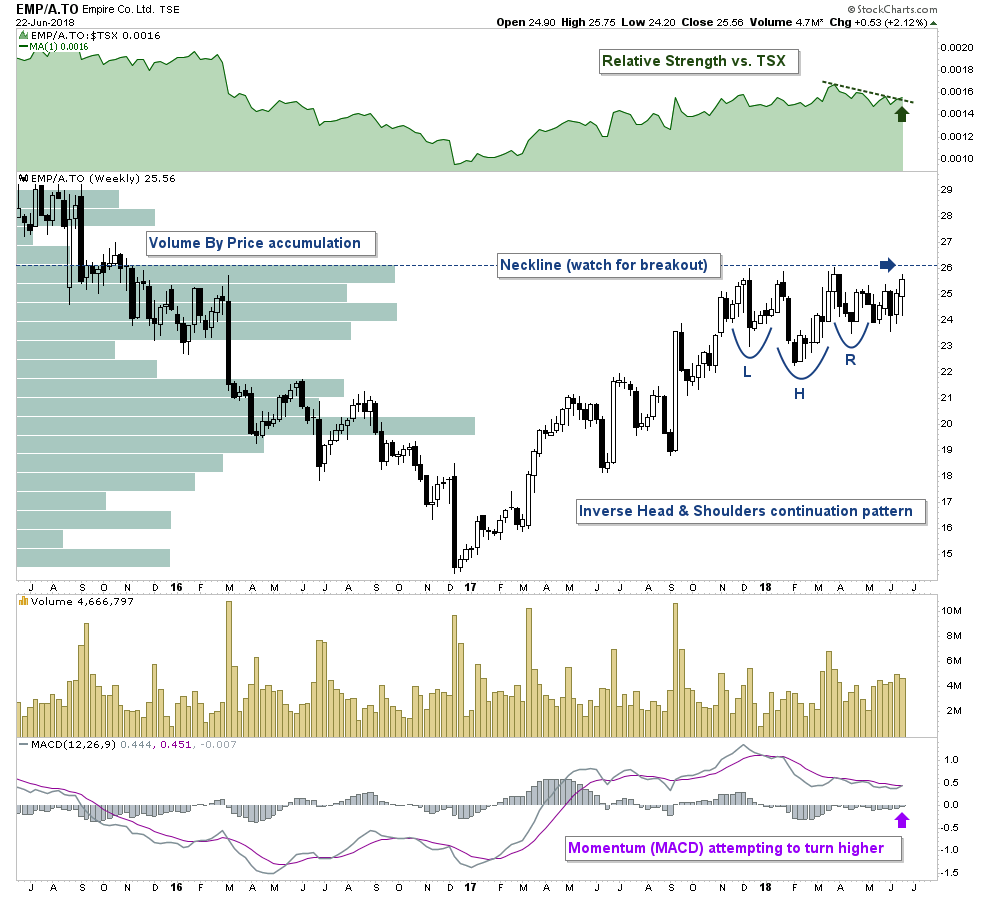
Empire (TSX:EMP.A) - Weekly Chart
Empire has been building a multi-month inverse head and shoulders continuation pattern. The neckline comes in at approximately $26. A breakout from this pattern would be very bullish as it would signal a new 31 month high and suggest a continuation of the prevailing uptrend.
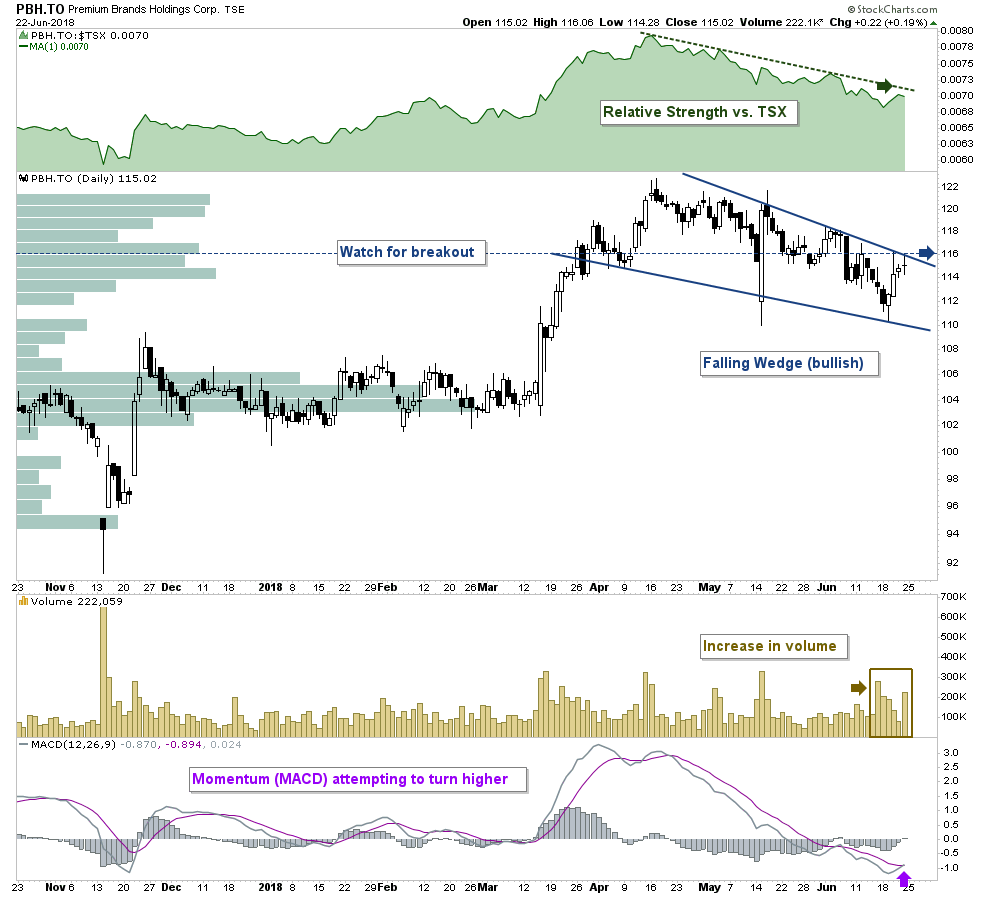
Premium Brands Holdings (TSX:PBH) - Daily Chart
Premium Brands Holdings has spent the last three months consolidating within a falling wedge continuation pattern. Last week price action surged to the top of the pattern on increased volume. With momentum (MACD) attempting to turn higher, a breakout from this pattern would be very bullish and suggests a continuation of the prevailing uptrend. Keep this chart on close watch for the breakout signal.
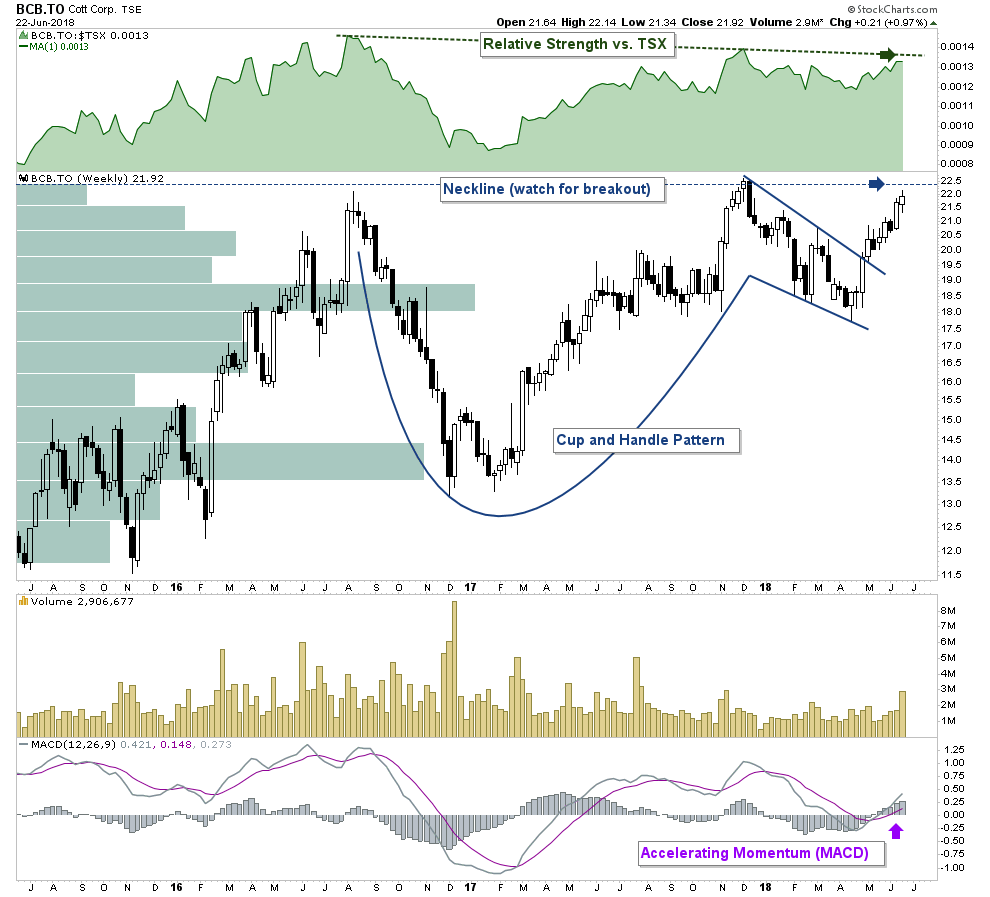
Cott (TSX:BCB) - Weekly Chart
Cott just broke out from a multi-month cup and handle pattern to near 13 year highs. With relative strength vs. the TSX attempting to breakout above its downtrend line and with very little upside resistance left to chew through, this price action is very bullish and suggests just the beginning of the next leg higher.
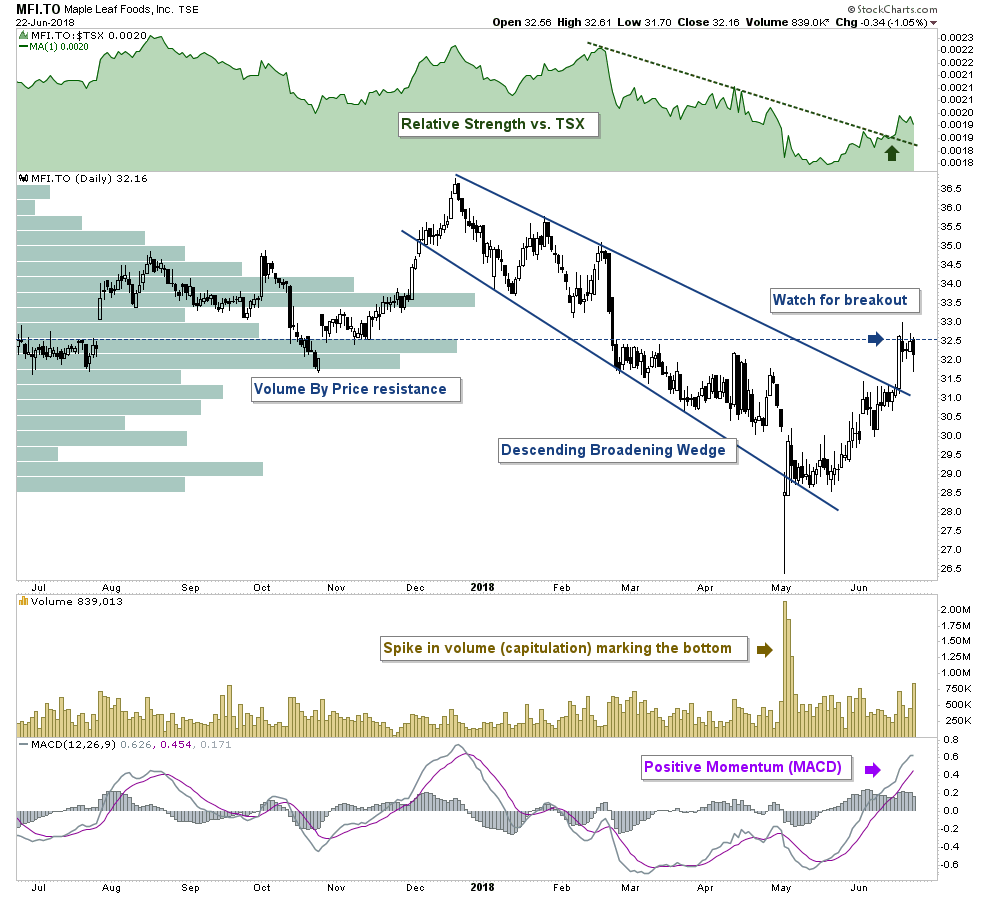
Maple Leaf Foods (TSX:MFI) - Daily Chart
Last week
Maple Leaf Foods broke out from a massive descending broadening wedge pattern. A descending broadening wedge is a bullish formation and tends to breakout to the upside. Price action is now consolidating within a bull flag pattern which is being compressed by a major volume by price bar. A breakout above this bull flag pattern would suggest a short-term measured move to the top of the pattern at approximately $36.50.
Telecommunications
There are no ETFs for the telecommunications stocks in Canada. Therefore today I'll be zooming in on 4 Canadian listed Telecommunication companies breaking out on seasonal cue.
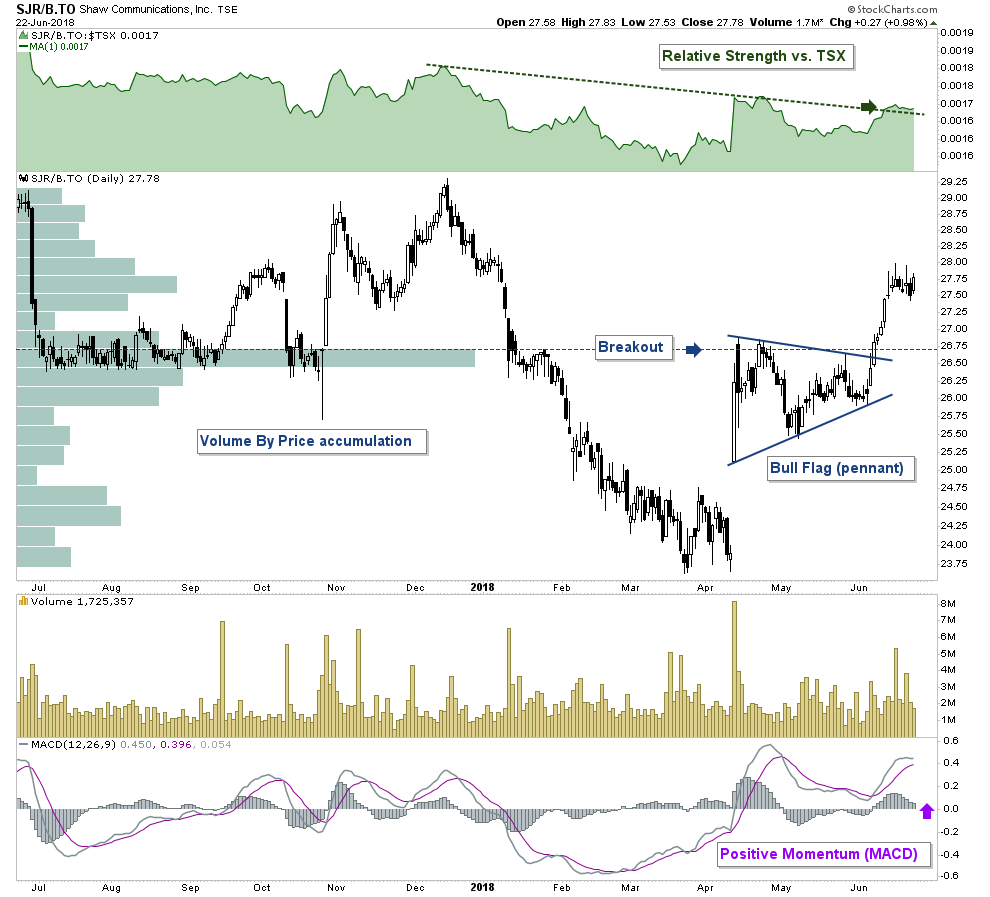
Shaw Communications (TSX:SJR.B) - Daily Chart
Shaw gave us our first momentum alert signal right on seasonal cue 3 weeks ago as it started to breakout from a bull flag (pennant) continuation pattern at $26.50. The real breakout then came at $26.90 as price action pushed above the major volume by price bar. This price action is bullish and the breakout suggests the start of the seasonal run.
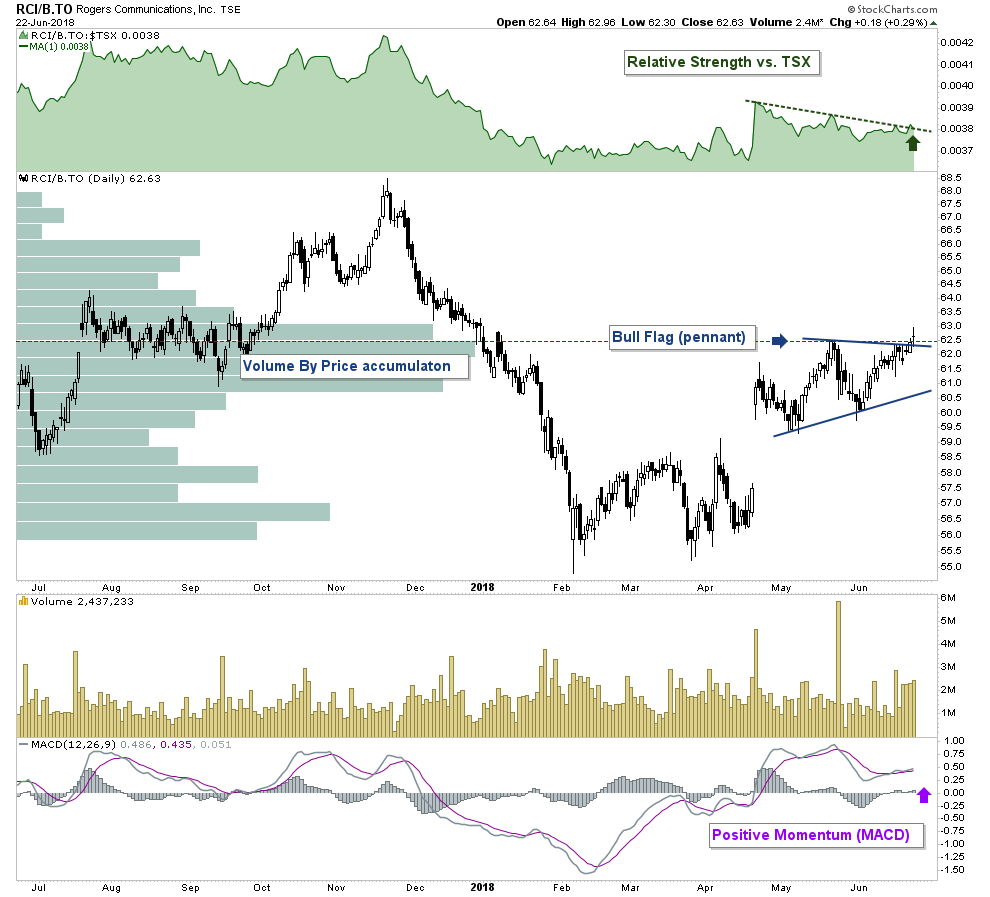
Rogers Communications (TSX:RCI.B) - Daily Chart
What I really like about the
Rogers Communications setup is that it's a mirror image of the above SJR.B setup before breakout. Price action is threatening to breakout from a bull flag (pennant) as relative strength vs. the TSX starts to push above its downtrend line. With the sector breaking out on seasonal cue, this price action suggests RCI.B is about to follow in the footsteps of SJR.B and accelerate higher.
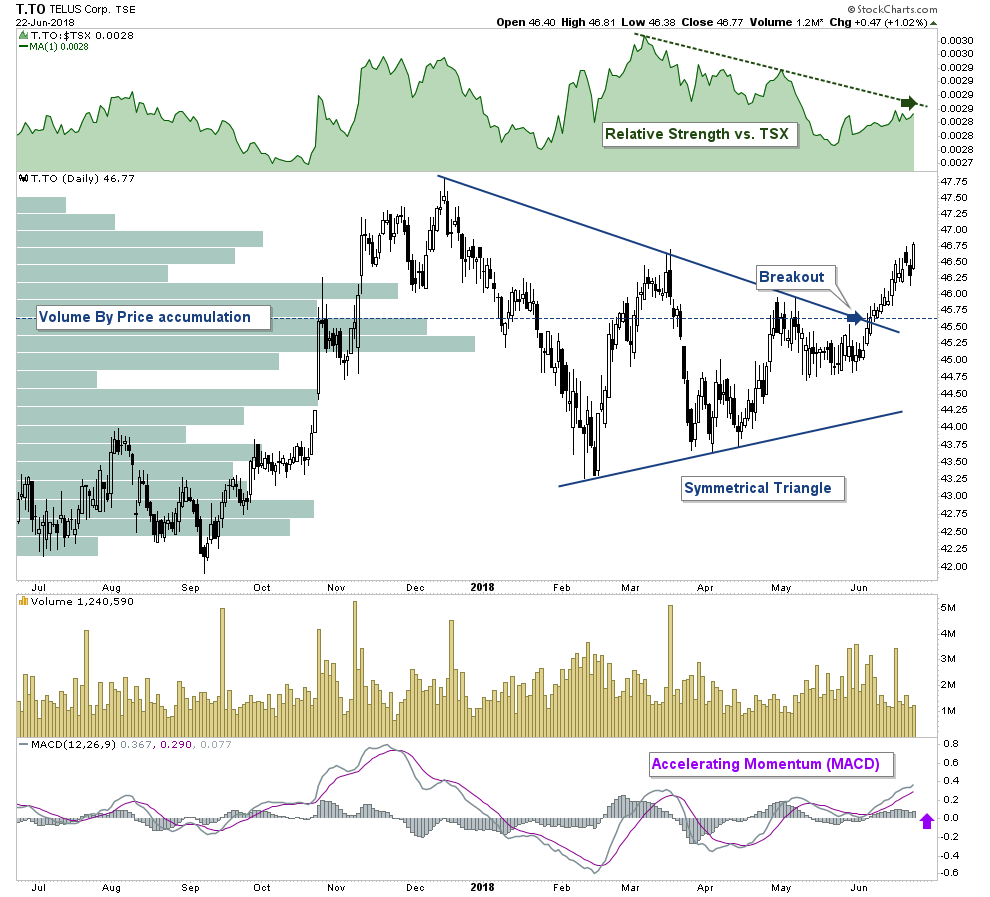
TELUS (TSX:T) - Daily Chart
After spending the last 5 months consolidating in a symmetrical triangle continuation pattern,
TELUS issued a momentum alert signal 3 weeks ago as it broke out from the pattern at $45.75. This price action was to be expected, suggesting the beginning of the seasonal uptrend is underway as momentum begins to accelerate higher.
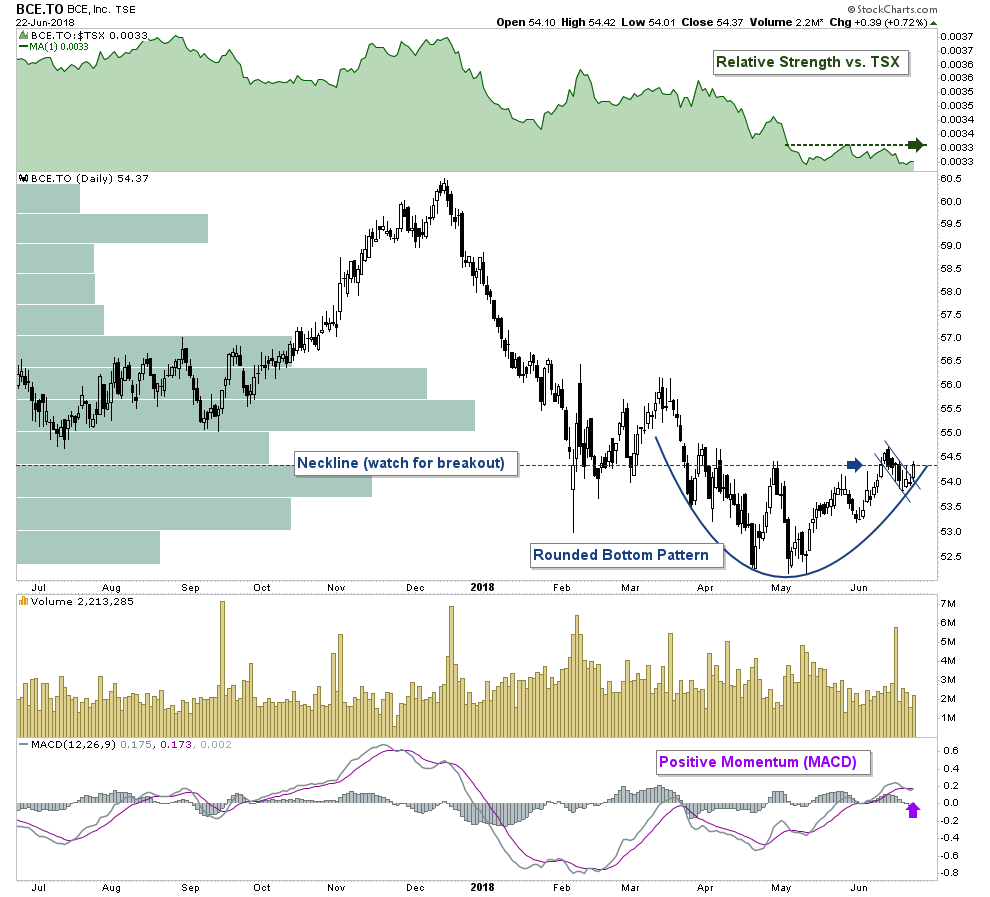
BCE (TSX:BCE) - Daily Chart
BCE has yet to give a signal. Although, with the rest of the sector pushing higher this is a name to watch closely. Price action has been building a rounded bottoming pattern and has now reached an apex. A rounded bottom pattern at the end of a prolonged downtrend can often suggest the trend is reversing. Watch for breakout.
Have a question? Sign up for free to ask 5i's Research Team your top question, plus get instant access to Canada's top stocks, three model portfolios, and over 75,369 answered investments questions. Get your free 5i Research Trial here.
Disclaimer: The author currently does not own any of these names within the next 72 hours.





Comments
Login to post a comment.