New Flyer Industries (TSX: NFI)
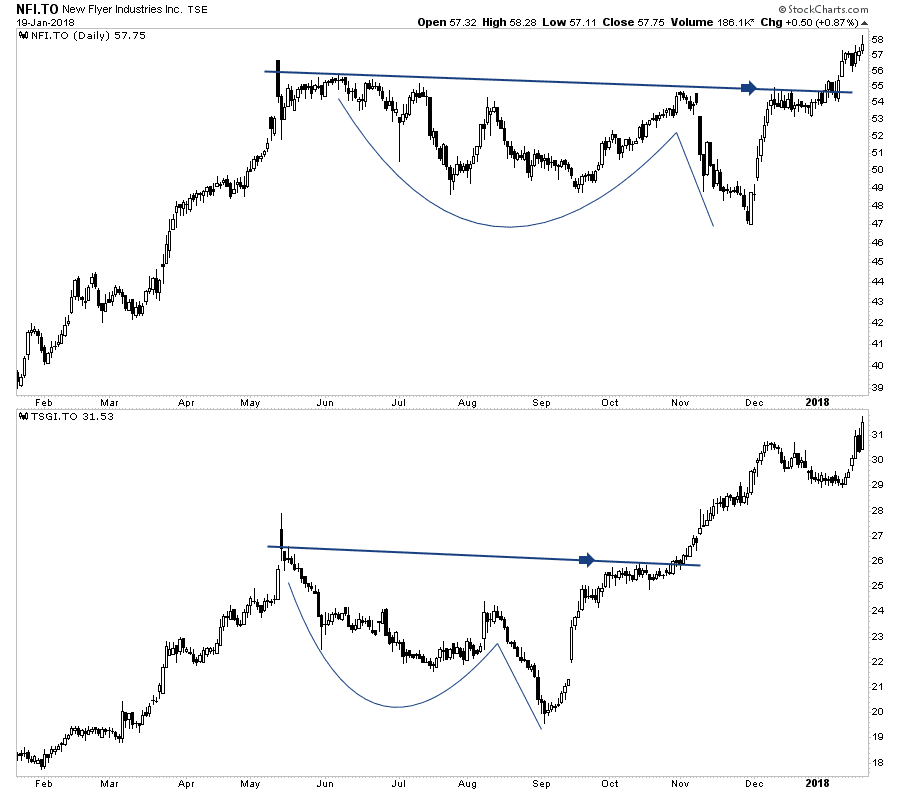
New Flyer Industries (NFI-T) has given a textbook trend following a signal. Price action spent the last eight months consolidating within a cup & handle continuation pattern before breaking out to new all-time highs.
Often people find it hard buying stocks at all-time highs. To show the potential of this type of breakout below, I included a chart of The Stars Group (TSGI-T), which in November had a very similar continuation pattern and breakout to what we are currently seeing with New Flyer. The Stars Group has since went on to yield approximately a 20% return.
View 5i's full report on New Flyer Industries in the member area here. If you're not currently a member, you can view the full report for free, by signing up for a 1 month free trial.

Great Canadian Gaming (TSX: GC)
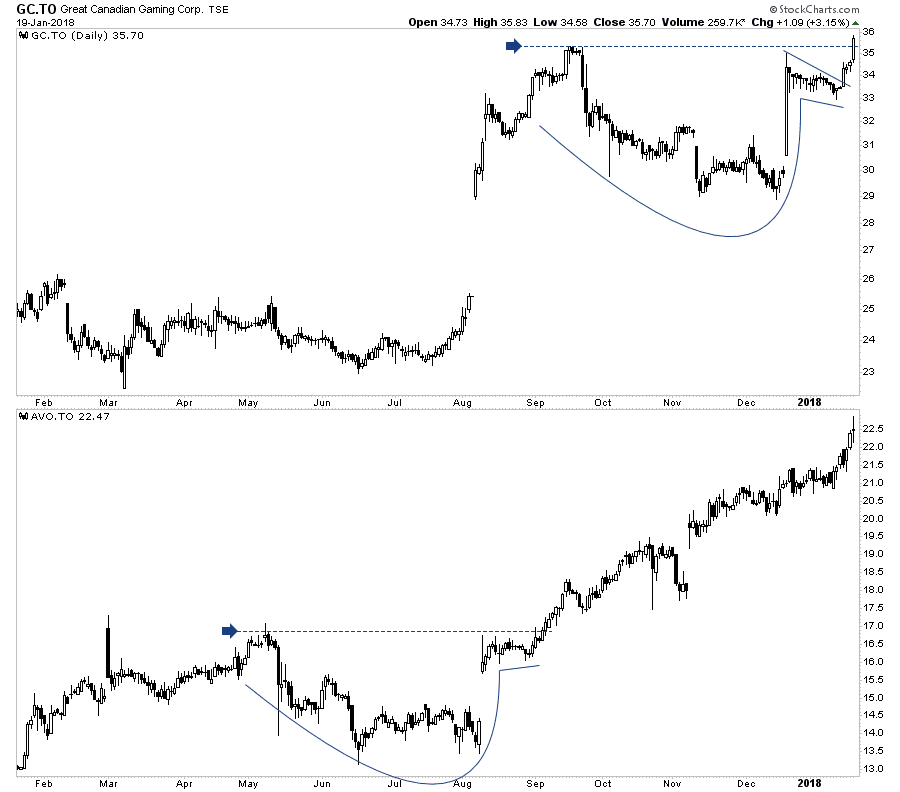
After gapping up in August, Great Canadian Gaming (GC-T) spent the last 5-months consolidating within a cup and handle continuation pattern. Price action went on to close last week at a new all-time high. This is also a textbook trend following signal.
To show the power of this type of setup, below I included a chart of Avigilon (AVO-T) which in August had a similar gap up to a consolidation pattern before momentum kicked in. Since, Avigilon went on to yield a 30+% return.
View 5i's full report on Great Canadian Gaming in the member area here. If you're not currently a member, you can view the full report for free, by signing up for a 1 month free trial.

Kinaxis (TSX: KXS)
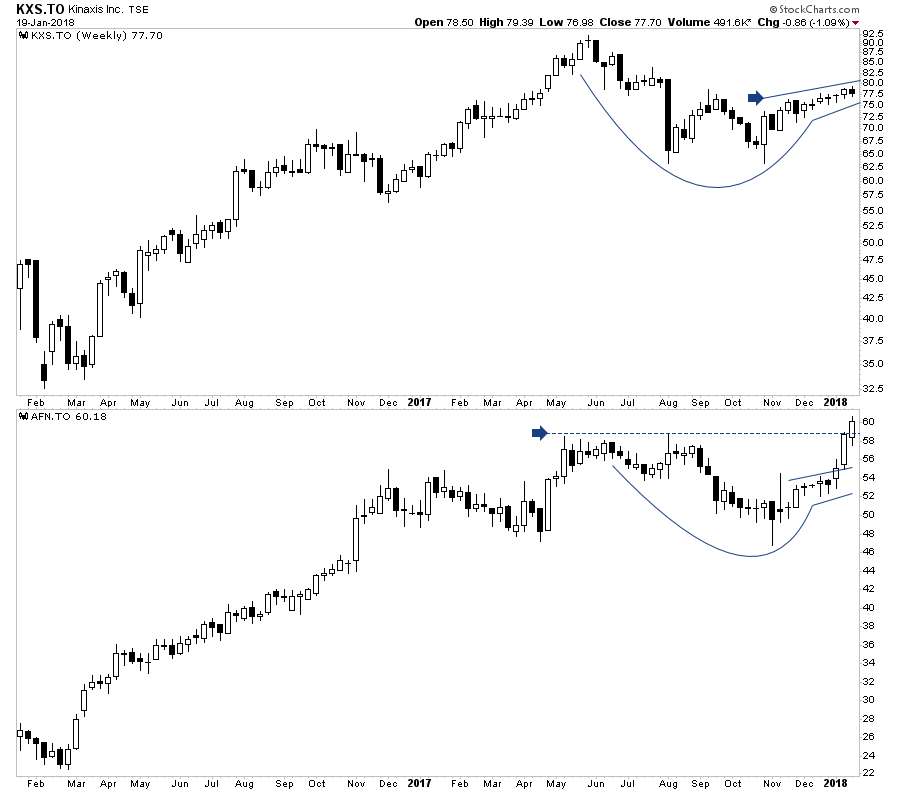
In my last blog post I featured the bullish rounded bottom pattern setup of both Kinaxis (KXS-T) and Ag Growth (AFN-T) on their weekly charts. Ag Growth has since broken out to new all-time highs. Kinaxis continues to consolidate in a tight trading range.
Watch for a breakout as periods of low volatility are often followed by periods of high volatility. This type of setup has the potential of being very explosive. Ag Growth is a prime example of how explosive the breakout can be, yielding 11% in the last 3 weeks since the breakout.
View 5i's full report on Kinaxis in the member area here. If you're not currently a member, you can view the full report for free, by signing up for a 1 month free trial.

Remember to view 5i's answered questions on these companies here. If you are not yet a member, get your free 1-month access here (no credit card required).
By Dwight Galusha from SetYourStop.com
The author currently does own NFI and KXS from the stocks mentioned above.
Nothing in this article should be deemed as a recommendation to buy or sell securities and is for informational purposes only. Please do your own due diligence before making an investment decision.


Comments
Login to post a comment.
What do you thing of CNR? Is it dangerous to buy it now knowing that it maybe influenced by NAFTA
Diane
Elmer
Thank you