Understanding market technicals becomes a very important tool when emotion takes over and price swings don’t make sense. This is especially true during times of uncertainty and periods of market volatility like we're experiencing now. Many people consider technical analysis voodoo and refer to it as people drawing lines on a stock chart. Although the drawing lines part might be true, technical analysis is about documenting investors psychology. Resistance and support levels, trendlines, market breadth and the VIX (market volatility index) are all created by fear and greed (people’s emotions). My job as a chartist is to document that fear and greed.
What most people don’t understand is that the stock market will bottom before the bearish news flow hits its peak. If anyone has tuned into the news, they’d think the sky was falling. I have also noticed through my interactions that investor psychology has flipped and in my “opinion” it is wrong. Many people were wrongly trying to buy every dip on the way down (wrongly attempting to guess a bottom). This pattern has lead to investors becoming too scared to look for buyable dips and are now resorting to selling at any chance they get.
I like to use the S&P500 as my trend indicator and the VIX as my fear gauge. As the old saying goes, "a rising tide will float all boats". When the S&P500 moves higher it forces money into most equities and causes the VIX index to collapse.
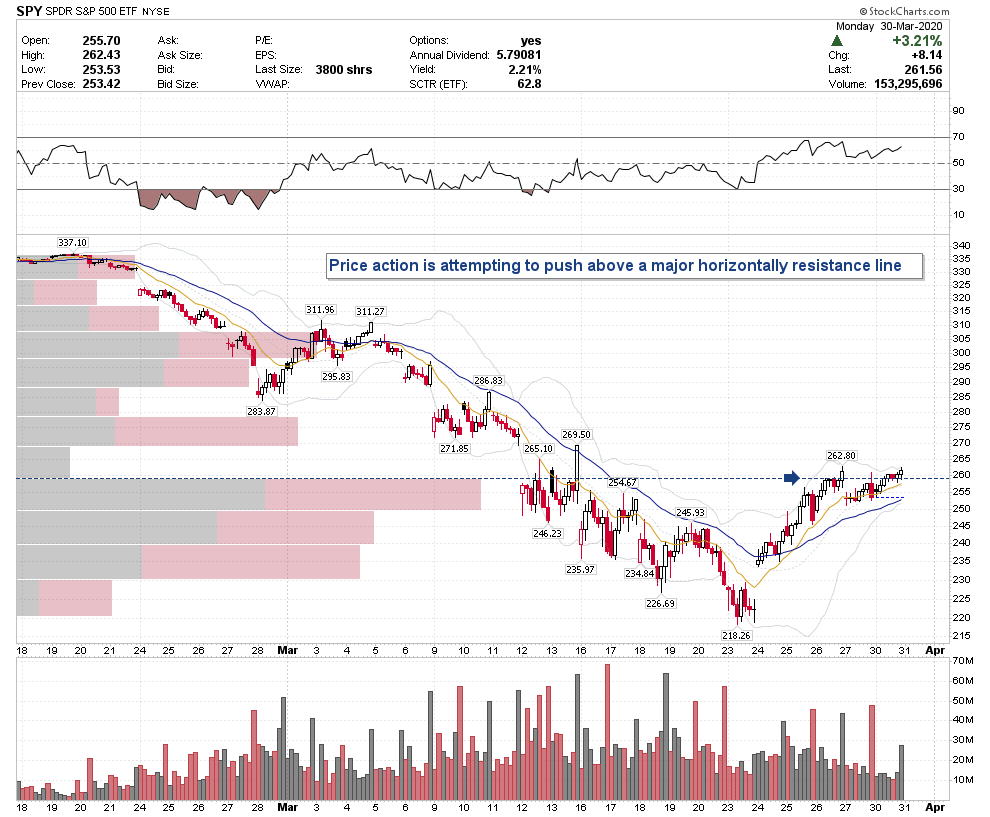
“The first two charts of the SPY and VIX index I’ll being using the 60-minute (timeframe) in order to zoom in on price action.”
First, I’ll look at the S&P500 price action via the SPY ETF that tracks the movement of the index. Right now, price is threatening to break above a major horizontal resistance line while investors are scared. The media keeps feeding into that fear while many investors feel like a deer in headlights after experiencing the rapid selloff. I don’t like to make predictions, but I like to watch and react. Right now, I’m watching the horizontal resistance line highlighted on the chart. A price move above that line would create a scenario where cash on sidelines is forced to race into the market causing short sellers to cover. The stock market always finds a way to hurt the most and this scenario would definitely hurt the most as investors are left on the sidelines.
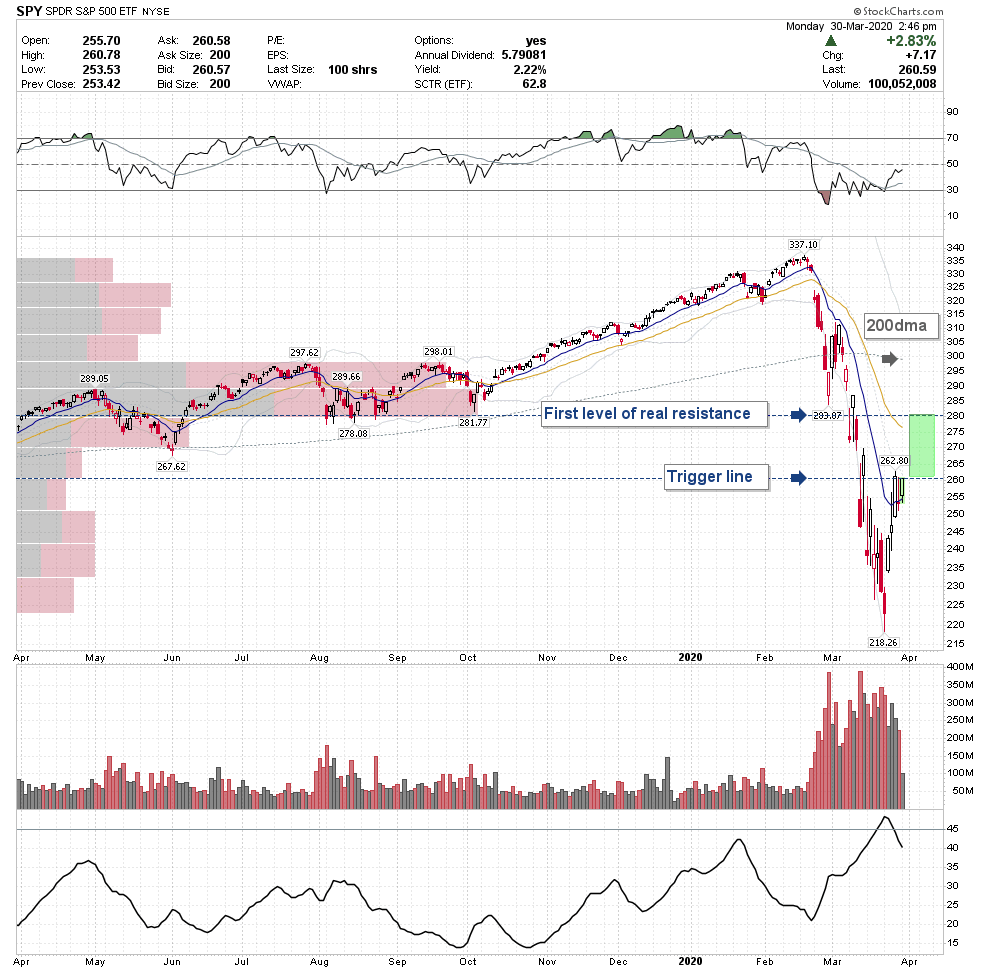
When looking at a daily chart of the SPY posted below, I highlighted the trigger line (horizontal resistance) and the upside pocket of air which identifies the first real level of upside resistance. That pocket of air leads to approximately 280 with the 200-day moving average just below 300 (which often acts as a price magnet).
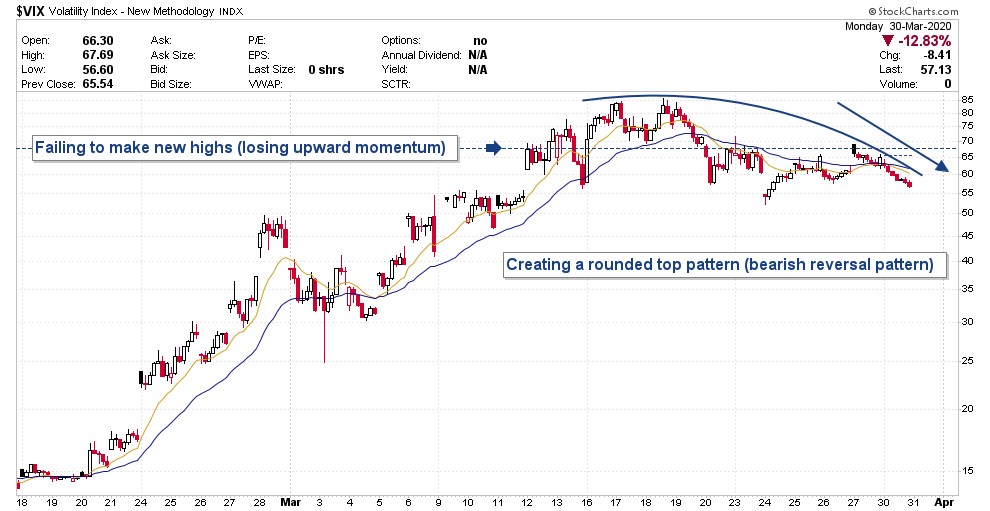
To identify clues that support this scenario, I used a 60-minute chart of the VIX (posted below). The VIX tends to rise when markets fall and investors reach for stock protection through the options market. As one can see, the VIX index has failed to make new highs (stuffed by the horizontal resistance line) and is now forming a bearish rounded top reversal pattern (or what I like to refer to as a leaky faucet right before the taps are turned on). A collapsing VIX would be bullish for stock prices as they continue to climb the wall of worry.
This leads me to the tradable lows in the Canadian technology sector. I don’t know if these patterns will mark the absolute bottom, but they are offering nice risk / reward setups to shoot against.
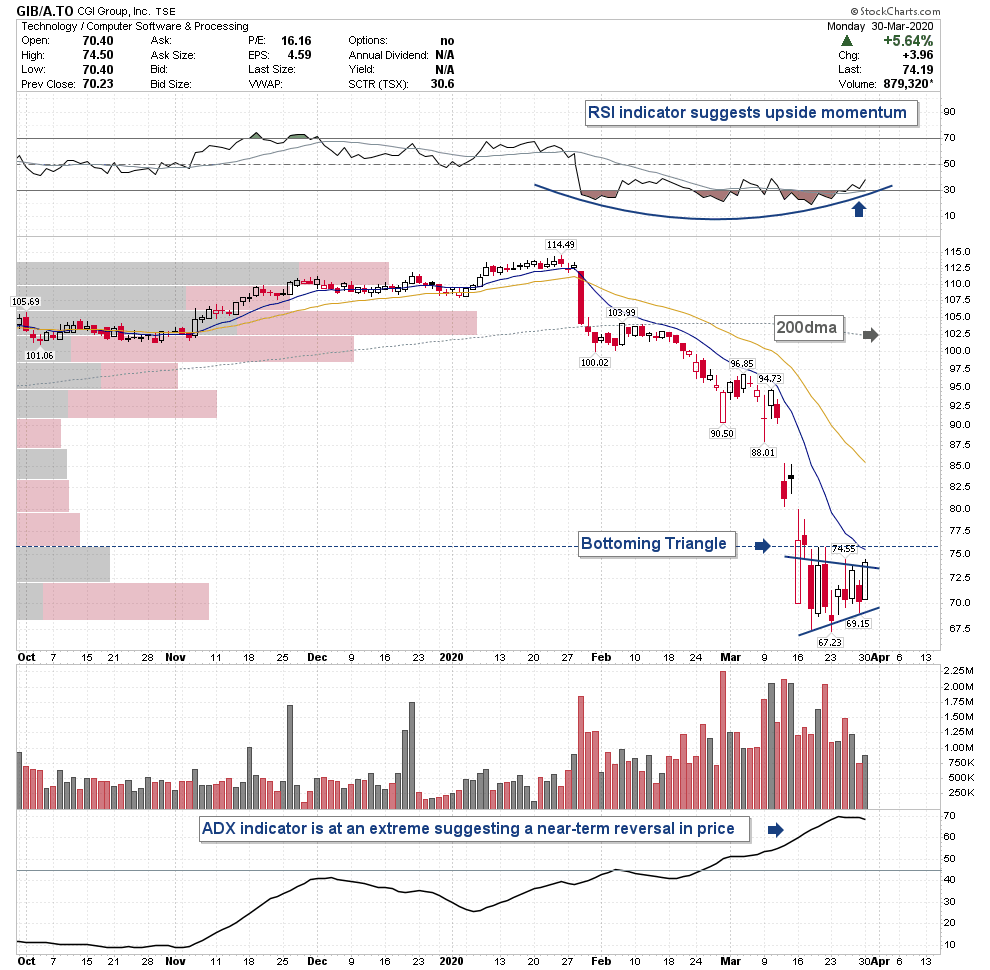
CGI Group (TSX:GIB.A)
After falling over 40% from the highs, CGI Group (TSX:GIB.A) is now attempting to complete a bottoming triangle pattern while the RSI indicator suggests the beginning of upside momentum. This price action has started to occur while the ADX indicator is rolling over from a rarely seen reading of 70. Combined, this price action is very bullish and suggests some type of mean reversion trade has begun. One can define risk setting a stop-loss order at the bottom of the pattern or near the recent lows.
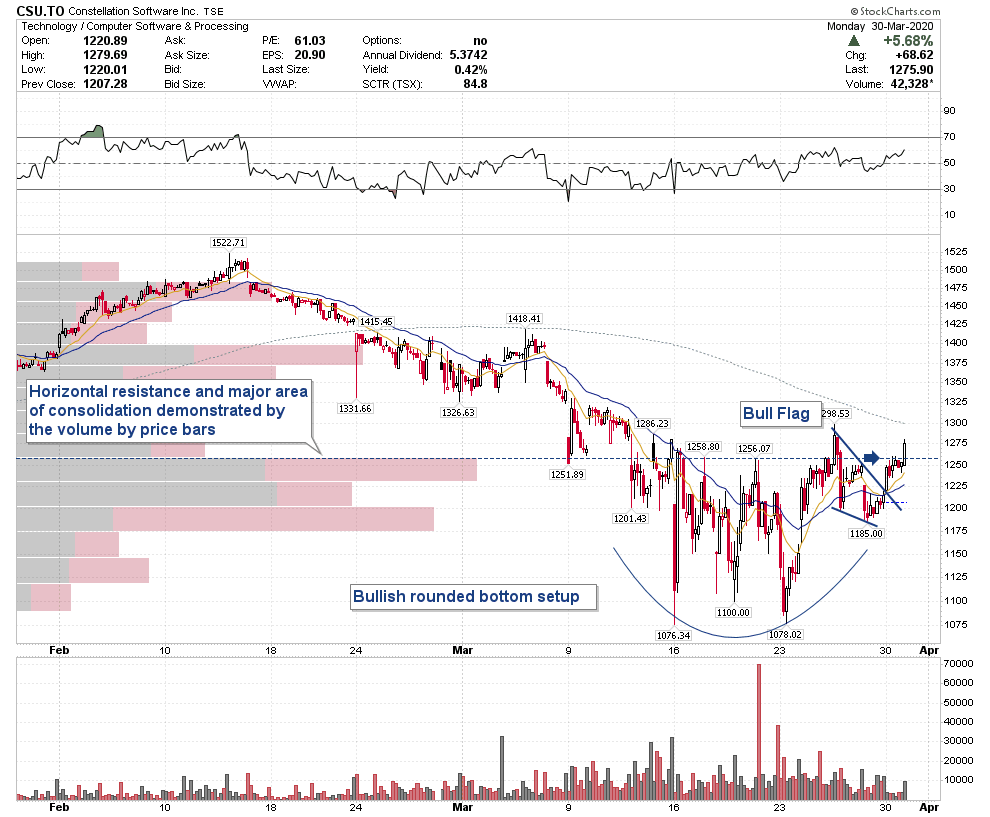
Constellation Software (TSX:CSU)
Today I’m using the 60 minute chart to zoom in on the price action of Constellation Software (TSX:CSU). Price action is now pushing higher from a bullish rounded bottom pattern. The price labels show how the stock first put in a double bottom at 1076.34 then the retest at 1078.02 (a higher low on the retest which is textbook) followed by an upside ramp to 1298.53. Since, price action has come back to successfully retest the breakout in the form of a bull flag pattern before breaking out above the horizontal resistance line. One must be aware that the 200-day moving average is currently at 1304 with more overhead resistance above. Although, this price action is encouraging.
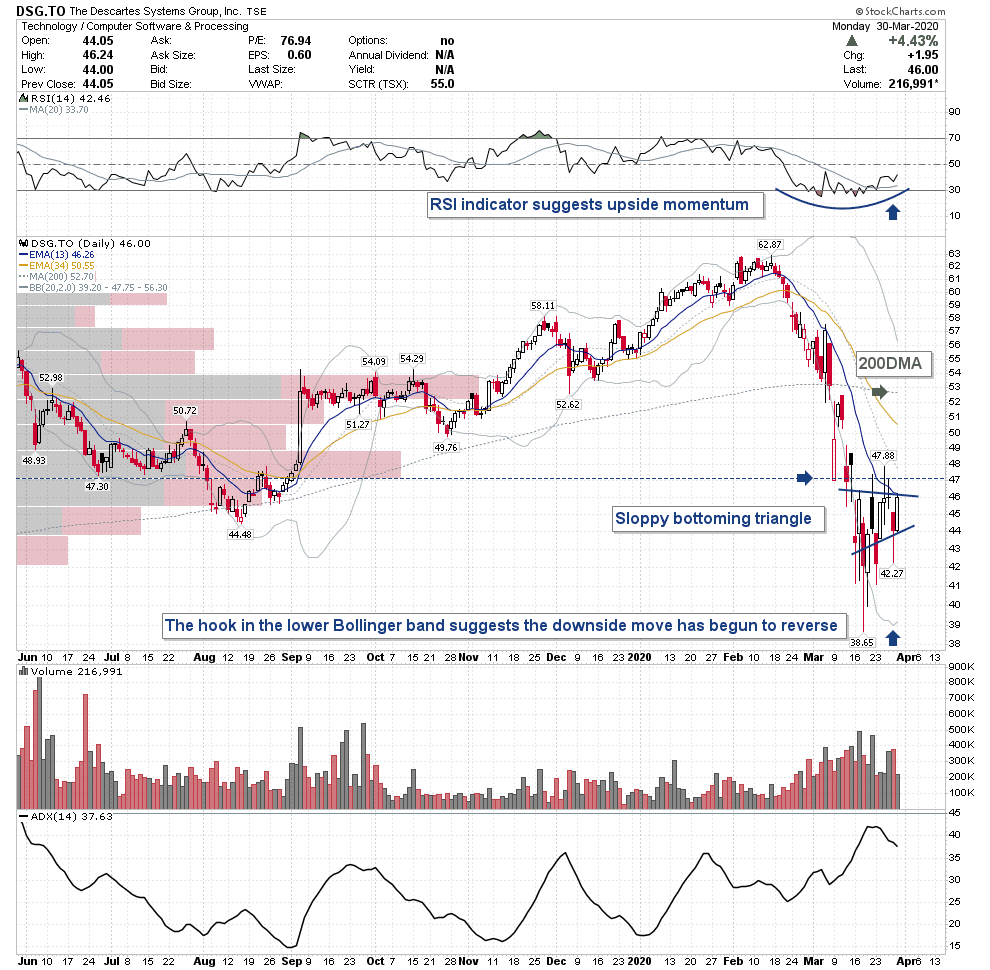
The Descartes Systems (TSX:DSG)
The Descartes Systems (TSX:DSG) is setting up very similar to that of CGI Group. Price action has created a sloppy bottoming triangle while the RSI indicator begins to suggest further upside momentum. The upward hook on the lower Bollinger band is also suggesting that the downside move is overdone. Watch for a breakout from this pattern as an implied measured move would take price to the underside of the 200-day moving average at approximately 52.70.
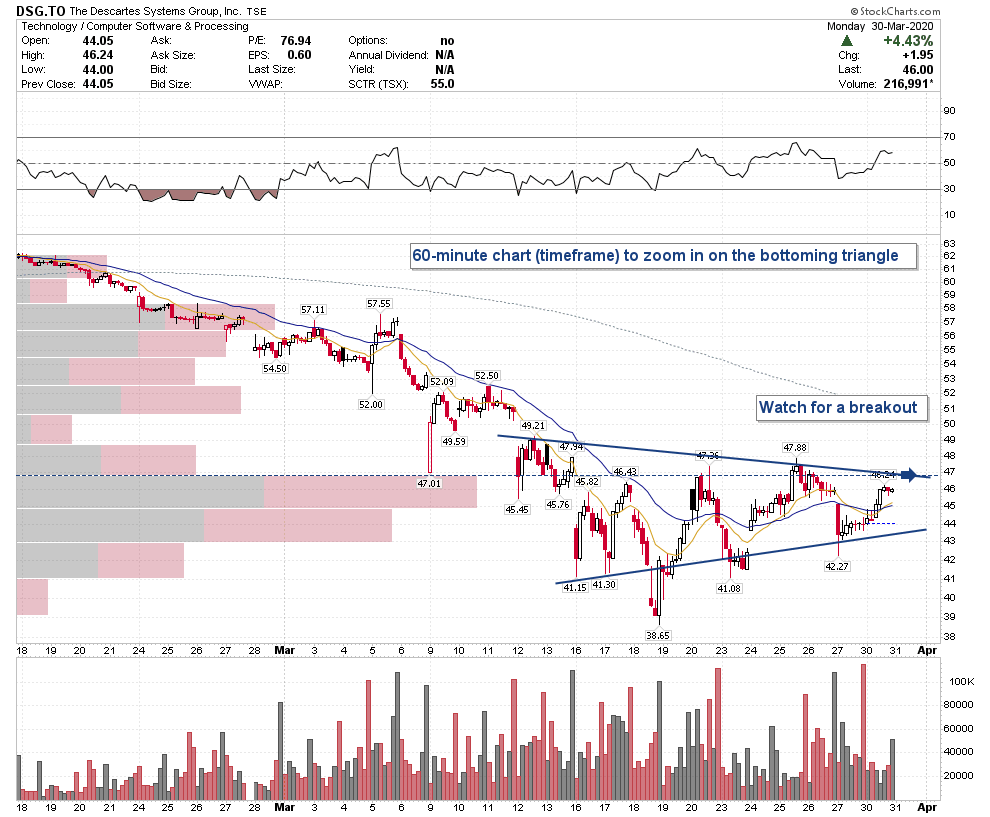
Below is a 60 minute chart of DSG to demonstrate how I use that timeframe to zoom in on price (as one can see it helps takes out the sloppy price movement).
Open Text (TSX:OTEX)
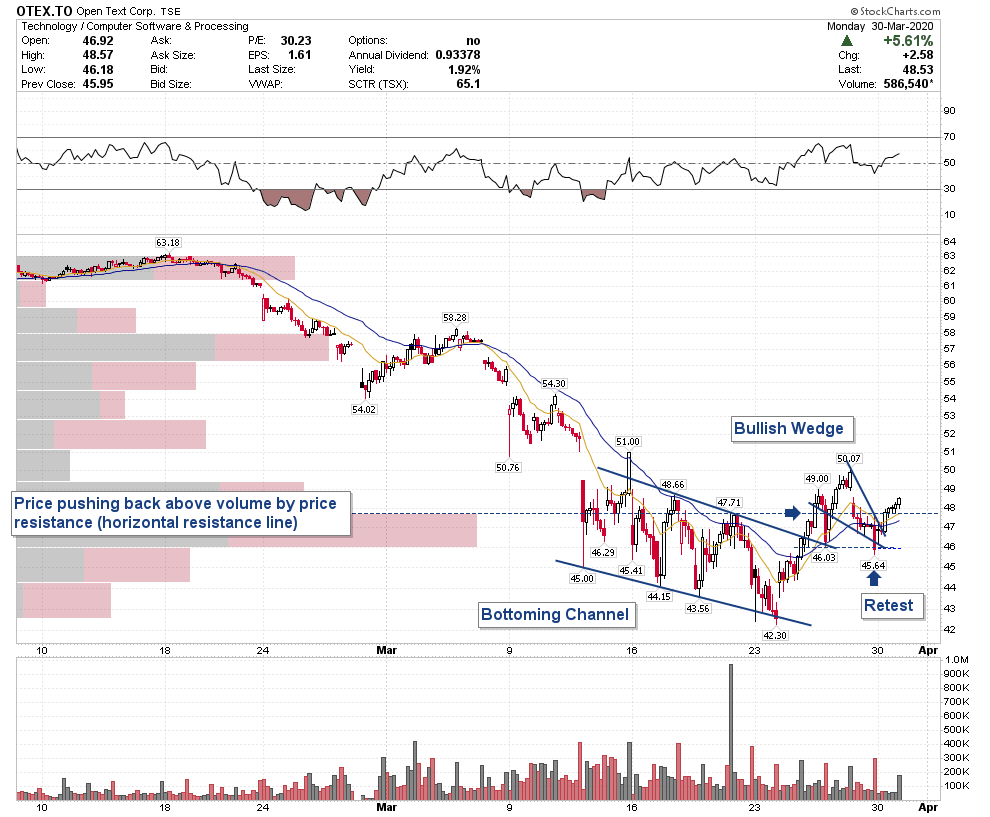
Open Text (TSX:OTEX) has completed a short-term bottoming pattern (as shown on the 60 minute chart below). After breaking out from the bottoming channel on the chart, price action ran to 50.07 before coming back to successfully retest the breakout in the form of a bullish wedge. This is a prime example of how it takes time for investor psychology to change as many people were wrongly trying to buy every dip on the way down (attempting to guess a bottom). This pattern has lead to investors becoming too scared to look for buyable dips and are now resorting to selling at any chance they get. The daily chart of Open Text doesn’t have any real upside resistance until the 200-day moving average at approximately 54.86 and the price action on the 60 minute chart is breaking out above a major volume by price resistance line.
Have a question? Sign up for free toask 5i's Research Team your top question. Start your 5i Research Trial here.
Written by Dwight Galusha from SetYourStop.com
The author of the article does not own a financial or other interest in the above-mentioned securities at the time of publishing.


Comments
Login to post a comment.
I have been in the markets for a long time once I think I am right and the market is wrong, it is time to hang them up and ride into the sunset. I never argue with the market. The market does not care what I think. We had a bear market rally. I tried to trade it. I won some and lost some. I watch the technicals and enjoy reading about the technicals, but I dont get lost in the weeds either. I really cant recognize a pocket of air, lol. Having said that, I agree that we are going to re-test the lows. It seems like a classic re-test to me, and I am not a technician. There is nothing on the horizon, at least near term, to turn sentiment around. Now, there are some stocks defying the trend. I dont trust the stay at home trade with ZM and TDOC. I think they may reverse once we see light at the end of the tunnel. But DOCU has been strong long before the virus took hold. What do the technicals say about the staying power of DOCU? You did not really answer that question.
Thanks for the insight.
Dave
Hello David,
I should've made myself more clear. The scenario I presented in the blog was for the S&P500 to get sucked into the pocket of air (above the horizontal line) shown on the chart. I live by the quote "expect the expected"... well the expected didn't happen. I've also come to learn that my crystal ball stopped working years ago and because of this I have to watch and react (the market doesn't care what I "think". My short-term S&P500 system gave a bearish signal on the morning gap lower. This gap negated my S&P500 scenario. The major problem now is history. Major selloffs of the this magnitude almost always see a retest of the low. Another startling stat is that the low has not held nearly 70% of the time.
Regarding the tech companies, I'm very impressed with their price action today. On a relative basis they outperformed (exactly what we want to see as a technician) and the technical patterns I presented in the blog held up perfectly. I still like the sector, my only concern is "if" the market goes back to retest the low. Technology is one of the sectors that tend to lead after the final low is created. It's definitely a place we want to be. Just right now it's time to be cautious. I hope this answers some of your questions.
My second comment was just to make you smile a little on this first of April!
Your article was very good, very well done.
Your doing a great job passing on your knowledge!
Thank you
Martin
Thanks for the insight.
Dave
Is this a April fool? Do I have to find the fish in the graphic?
Martin
I really enjoy your technical analysis of the current market. It make sense right now, we will see in the future if it is right. There is so many indicator that we can use depending of the type of market we go thru. Personally, I use only a few that I learn and use . VIX is one that I will keep in my book for this type of market.
Thank you
Martin