Identifying breakouts from strong chart patterns is a skill that allows investors to take a position in stocks during the early stages of an uptrend. Often these breakouts can be the starting point of a major price move. A breakout to new highs makes this strategy even more favorable as there's no resistance (overhead supply) from people selling at a loss or breakeven. This asymmetrical equation can translate into an acceleration in upside price momentum. When combined with a dividend, this strategy can be very profitable. It also doesn't hurt getting paid to wait until upside price momentum kicks in.
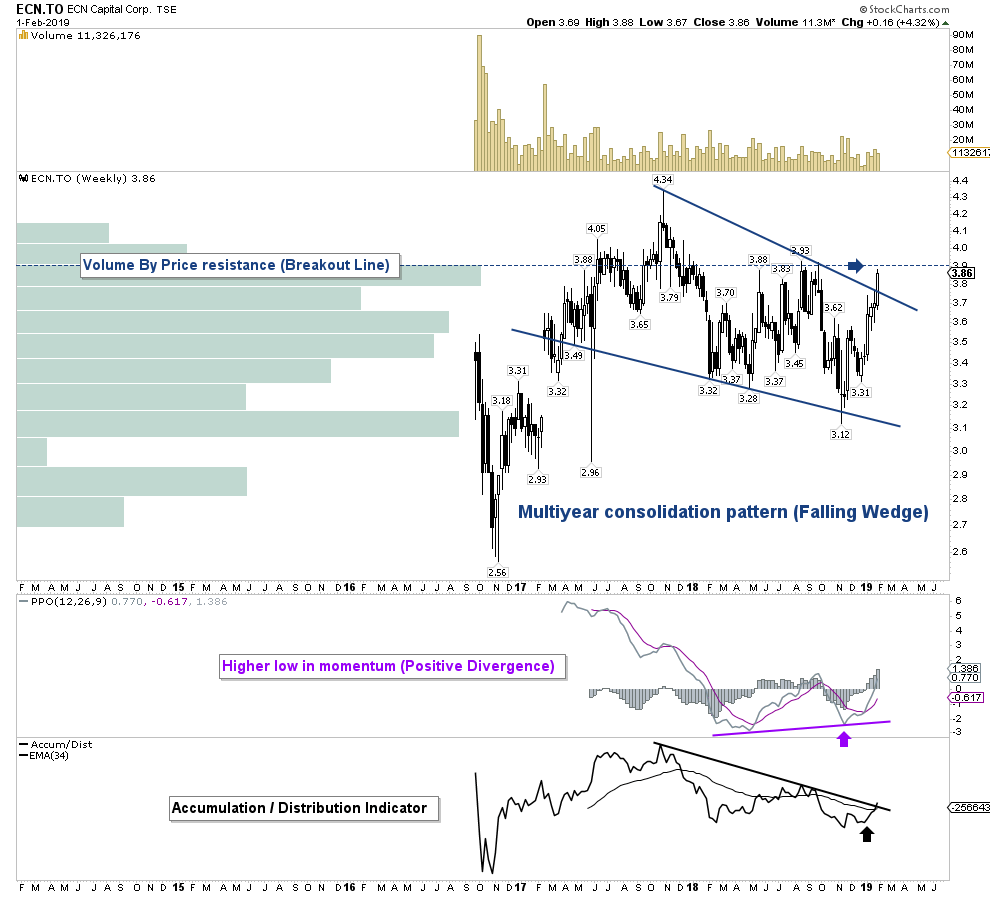
ECN Capital (TSX:ECN)
- Weekly Stock Chart
ECN Capital (TSX:ECN) has spent the last 2 years consolidating within a falling wedge continuation pattern. The falling wedge is a technical pattern used to spot a decrease in downside momentum while allowing technicians to identify the potential of an upside trend reversal. The falling wedge is one of the most profitable patterns to trade (statistically breaking out to the upside 92% of the time). The probability of an upside breakout increases when confirmed with other technical indicators such as the percentage price oscillator (PPO). As you can see the PPO at the bottom of the chart was demonstrating a positive divergence. Positive divergence occurs when the price of a stock is in a downtrend while the momentum indicator (PPO) is beginning an uptrend. This combination is very bullish and was suggesting that price action was close to breaking out. Despite the high probability technical setup, the final confirmation of this breakout (trading signal) will not occur until price action convincingly breaks out above the resistance line drawn on the chart and the PPO indicator cross above the zero line. Watch for a breakout.
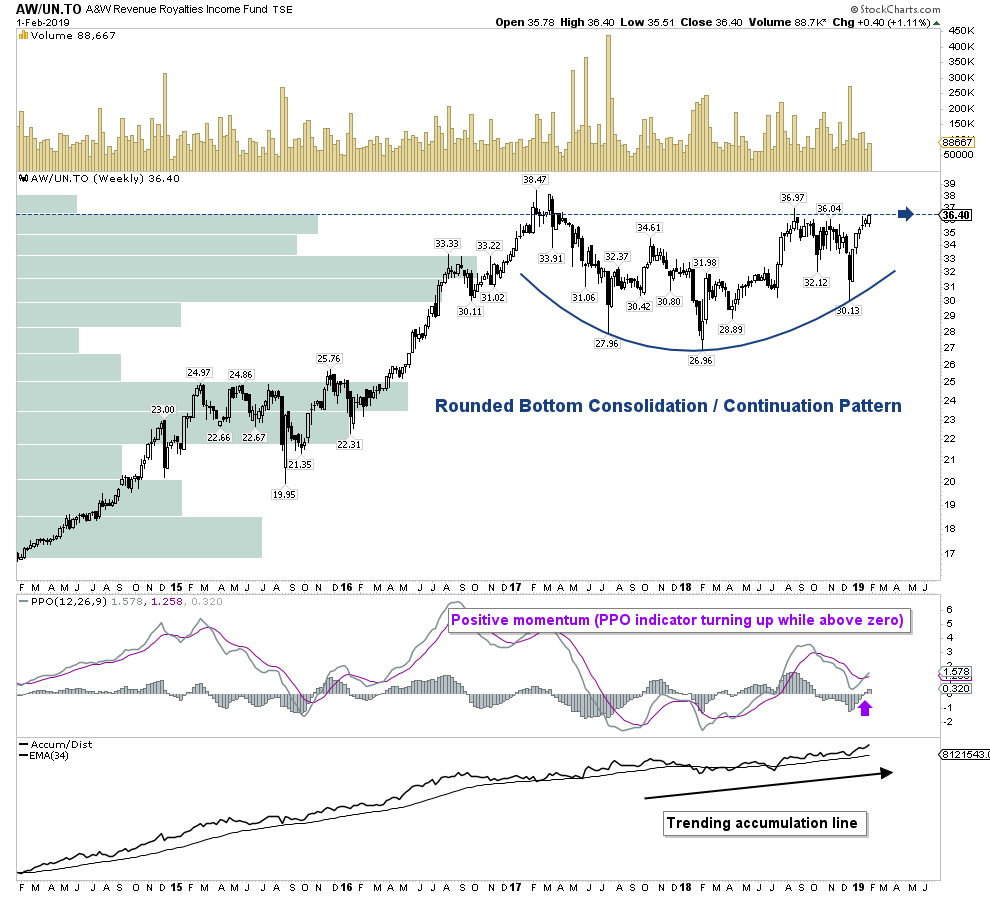
A&W Revenue Royalties Income Fund (TSX:AW.UN)
- Weekly Stock Chart
A&W Royalties (TSX:AW.UN
) has been in consolidation for nearly 2 years within a rounded bottom continuation pattern. Price action is now close to completing this technical pattern as it pushes up against the underside of a major resistance line and nears a new all-time high. A bullish confirmation would be signaled on a breakout above the resistance line which is drawn on the chart. The probability of this breakout occurring is extremely high with the PPO indicator turning up while above the zero line (indicating positive momentum). The trending accumulation/distribution line is also helping to determine the path of least resistance. Watch for a breakout because the momentum dynamics often shift (accelerate higher) when a security reaches a new all-time high.
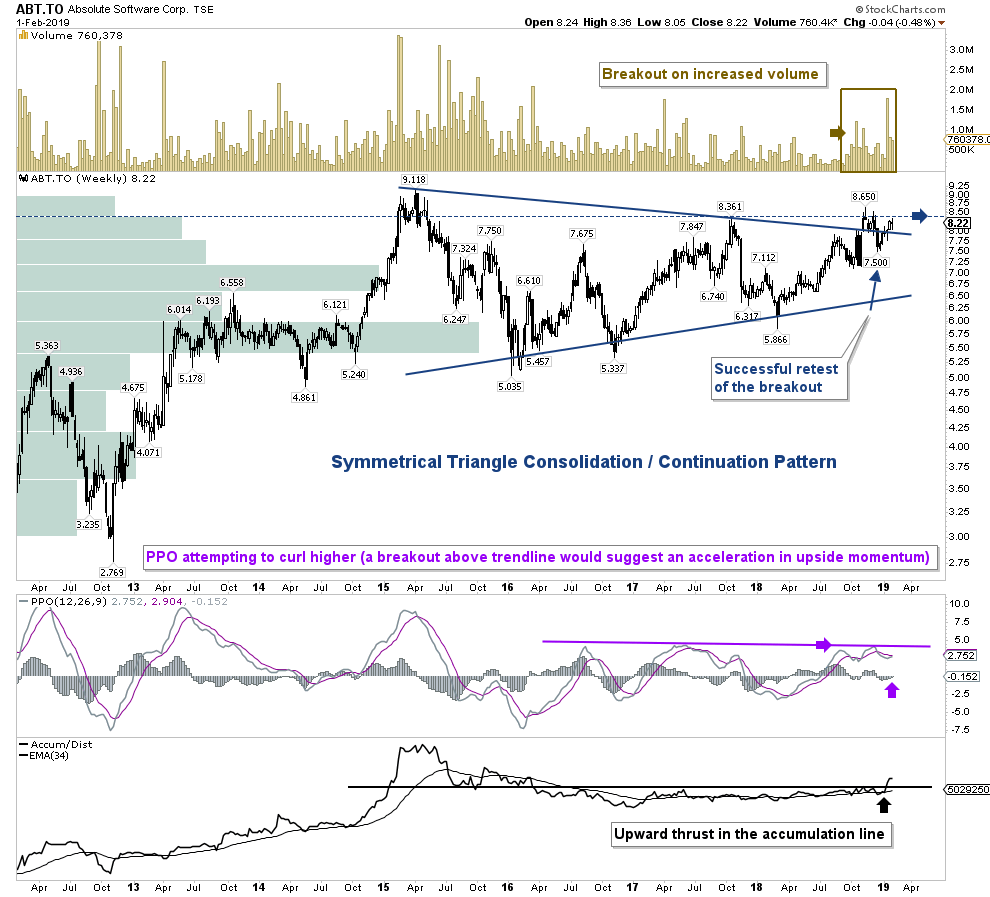
Absolute Software (TSX:ABT)
- Weekly Stock Chart
Absolute Software (TSX:ABT) has consolidated over the last 4 years within a symmetrical triangle continuation pattern. Technically, as the triangle forms and the trading range contracts, volume should decline as it has on the chart. This refers to the calm before the storm as I've pointed out in other blogs. Upon breakout, volume should expand. Periods of low volatility are often followed by high volatility. This is exactly what has occurred. Price action began an upside breakout on November 5th from this pattern on increased volume. Since then, the price has come back to successfully retest the breakout. Not only has this price action been textbook, but it also suggests the beginning of a new uptrend could be underway as price pushes toward a 52-week high. As the saying goes in technical analysis, "the bigger the base, the higher the space." A price move above $8.65 would push the PPO indicator through the trendline drawn on the chart suggesting an acceleration in upside momentum.
Have a question? Sign up for free to ask 5i's Research Team your top question, plus get instant access to Canada's top stocks, three model portfolios, and over 75,369 answered investments questions. Get your free 5i Research Trial here.


Comments
Login to post a comment.