Many companies trading in the Canadian stock markets such as the TSX and TSX Venture exchange go through periods of consolidation where not a whole lot happens with either the share prices or the fundamentals at the company. This is where technical analysis can be helpful as it provides a bit of a guide as to when these 'quieter' stocks may be set to make a move. Here are a few stock charts with companies poised to trend higher.
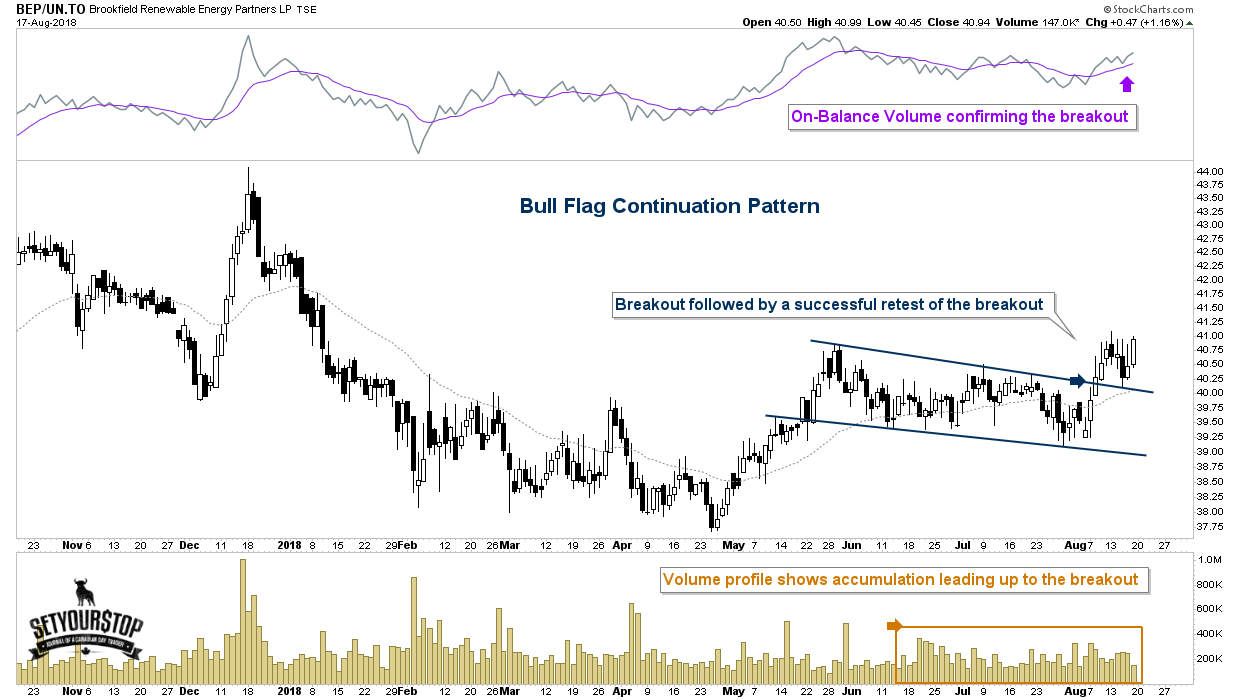
Brookfield Renewable Energy Partners (TSX:BEP.UN)
- Daily Stock Chart
Brookfield Renewable Energy Partners stock chart has broken out from a bull flag continuation pattern after consolidating for multiple weeks. Last week, price action came back to successfully retest the breakout. The volume profile shows accumulation leading up to the breakout which is very bullish while the On-Balance Volume indicator confirms the breakout. The interpretation of the OBV (On-Balance Volume) indicator states when price direction is up and the OBV direction is up, price action is in a uptrend.
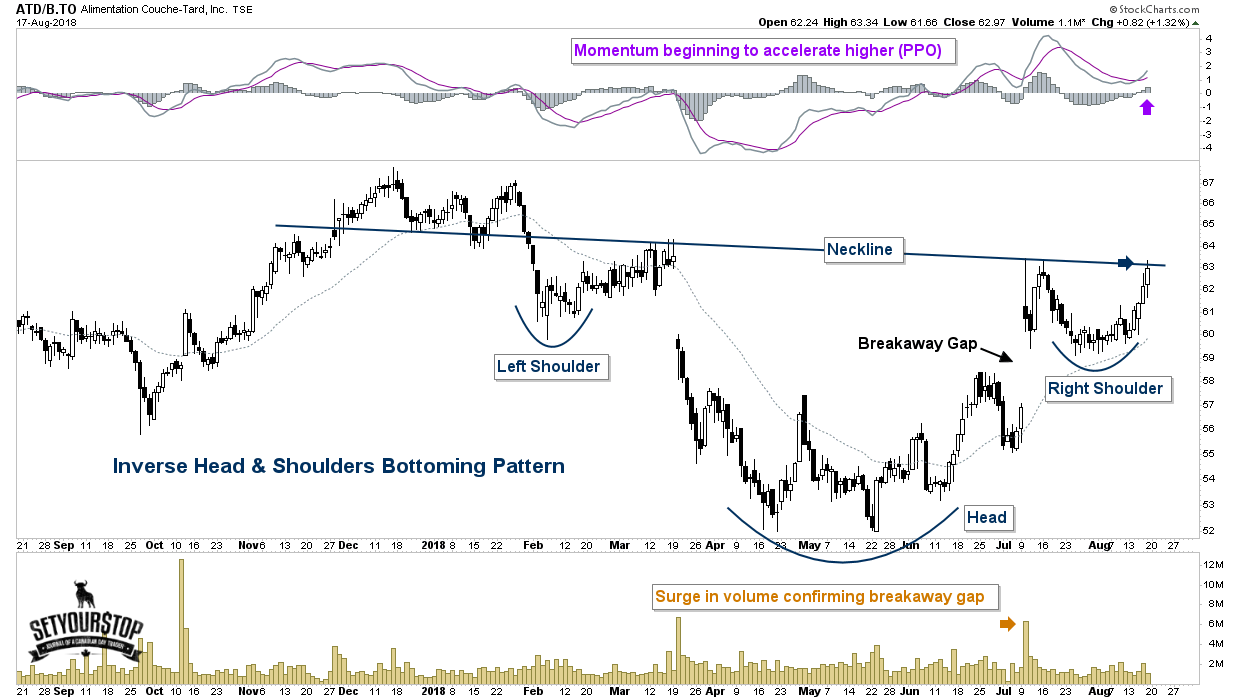
Alimentation Couche-Tard (TSX:ATD.B) - Daily Stock Chart
Alimentation Couche-Tard is near the completion of an inverse head and shoulders bottoming pattern. On the morning of July 10th price action completed a breakaway gap on heavy volume which was created by a better than expected earnings report. A breakaway gap is an important event because it often marks the start of a new trend. In this case it lead to the construction and completion of the right shoulder. Now price action is pushing up against the underside of the neckline (resistance) as momentum (PPO indicator) begins to accelerate higher. This price action is very bullish as a breakout above the neckline would complete the inverse head and shoulders pattern and suggest the beginning of a new uptrend.
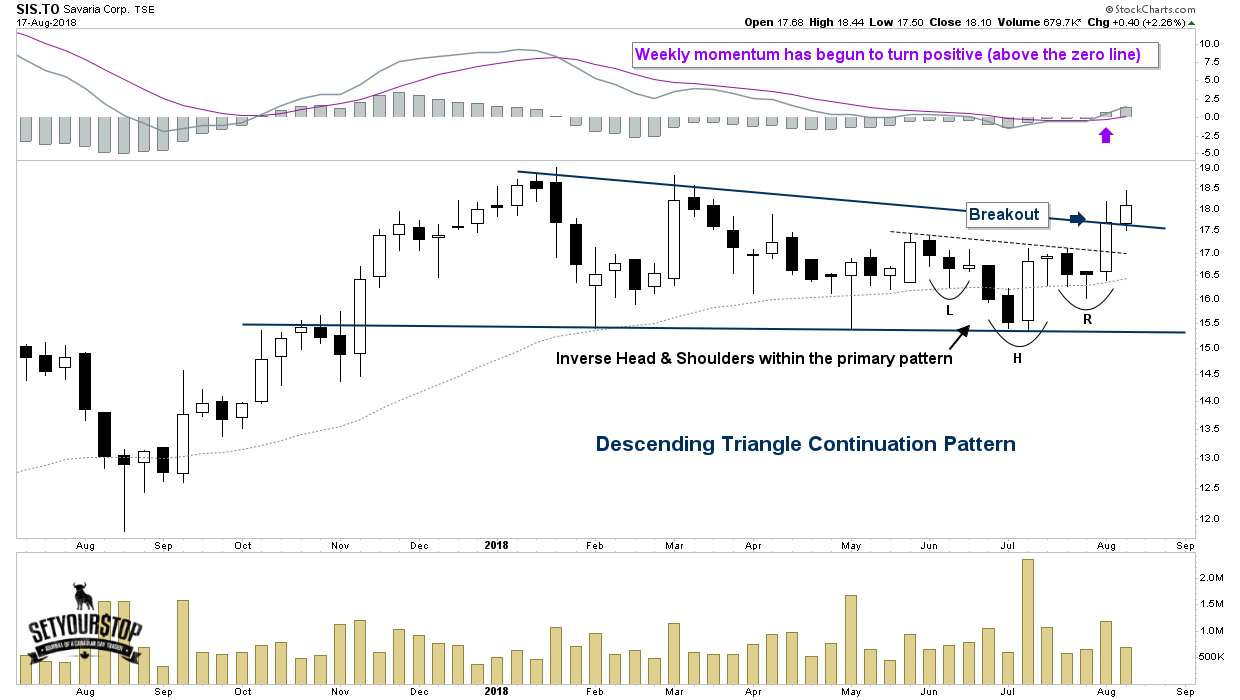
Savaria (TSX:SIS) - Weekly Stock Chart
After consolidating over the last 9-months, Savaria has just broken out from a massive descending triangle continuation pattern as momentum (PPO indicator) begins to turn positive. When using momentum as a trend indicator, a buy signal is generated when the value of momentum turns from negative to positive as seen on this chart. This price action is extremely bullish especially when combining the breakout with the PPO signal as it heightens the probability that a new uptrend is now underway. As the technical stock market saying goes, "the bigger the base the higher the space."
Disclaimer: The author currently does not own any of these names within the next 72 hours.


Comments
Login to post a comment.