
Report Updates
We have posted report updates on GDI Integrated Facility Services (GDI), Pason Systems (PSI), and H&R Real Estate Investment Trust (HR.UN). GDI is an outsourced cleaning service provider in North America that completed three large acquisitions in 2022 as they expand their presence in markets such as Quebec and Ontario. Tight labour supply is a concern, with some pressure expected on margins for a short while. PSI offers exposure to the oil industry with a low capital-intensive business model. PSI provides data and management solutions to oil and gas drillers and posted a solid quarter with top-line sales improving 60% over the past year. Its dividend was raised by 50%. HR.UN is one of Canada’s largest Real Estate Investment Trust and has a high exposure to residential and office spaces. HR.UN also offers exposure to the US Sunbelt and reports strong occupancy across its portfolio. All three companies service different industries with variations in growth strategy and risk factors.
Read the latest updates by logging in here!
Investor Sentiment Survey
Thank you to all of those that have participated in our investor sentiment surveys thus far. We feel that these surveys have added value to our thought process on the current investment landscape, and we hope that you all have felt the same.
The survey shouldn't take more than 5 minutes and no personal details are required.
Let us know how you are feeling about markets and the economy by following the link below! We will let you know the results in our next market update.
Investor Sentiment Survey
Market Update
The markets have largely traded in a sideways range over the past few weeks, although there was a strong bounce in the markets today from the weaker-than-expected US CPI data for November. Oil and the US dollar have been trading lower, and this has positive implications for risky assets and future inflation reports. The Federal Reserve is announcing its interest rate decision tomorrow, and investors are awaiting the outlook for rate hikes, if any, in 2023. In this market update, we reflect back on previous market updates and highlight a few key charts that we have posted throughout the year, and their respective updated versions.
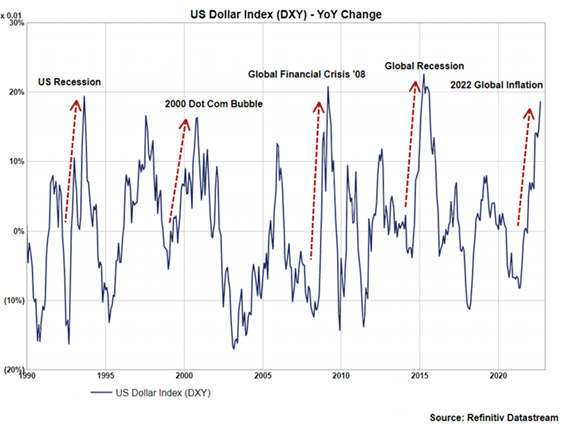
Market Update September 29 – US Dollar Strength
In the above-listed market update in September, we talked about the strong year-over-year change in the US Dollar Index (DXY). The DXY measures the value of the US dollar against a basket of six foreign currencies, and over the past year we have seen the index rise significantly. The substantial move that the DXY has shown this past year (~+20%) has also been seen in other years – 2015, 2009, 2001, and 1993. A strong US dollar creates headwinds and downward pressure for risk assets, as investors flee risky assets in search of a safe haven, traditionally the US dollar. This is the type of activity that we have been witnessing this past year, and the inverse correlation that the US dollar and stocks have, has worked against equities’ performance this year.
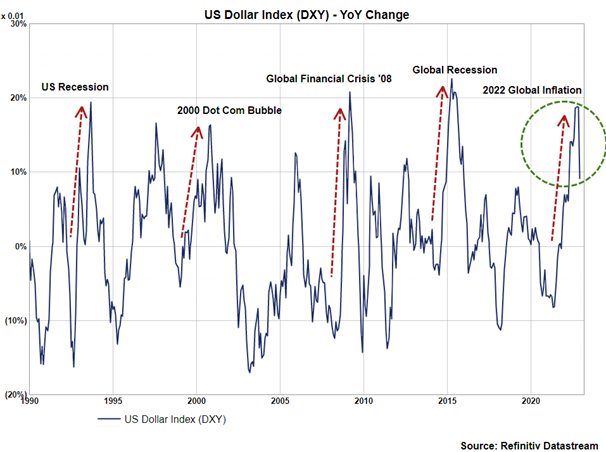
As we can see on the second chart, since we initially posted the chart in September, however, the DXY has been moving lower on a year-over-year basis. This move lower in the US dollar should help risk assets going forward, as investors diversify into other assets, besides the safe haven of the US dollar.
September 29th Chart
Updated Chart
Market Update Sept 15 – The Markets Lead the Business Cycle
In the September 15th market update, we talked about the disconnect between stocks and data emerging from the economy. This disconnect occurs for two main reasons – one is that the economic data usually has a significant lag, and thus may not be as relevant anymore, and secondly, the financial markets are forward-looking. The Purchasing Managers’ Index (PMI) survey is the best leading indicator of the business cycle. The index looks at where the economy is heading, and we have found there is a clear correlation between the PMI survey and the year-over-year change in equities. We can see in the charts below that the PMI and US equities have moved in tandem over the past ~30 years, and this tight correlation is because they are both forward-looking.
In the September 15th market update, we make the point that the S&P 500 has effectively priced in a decline in the business cycle, and it has already moved to a level that is in line with previous levels of business cycle lows. The updated PMI and S&P 500 chart shows that the business cycle continues to move towards a trough, and US equities have largely priced this in.
September 15th Chart
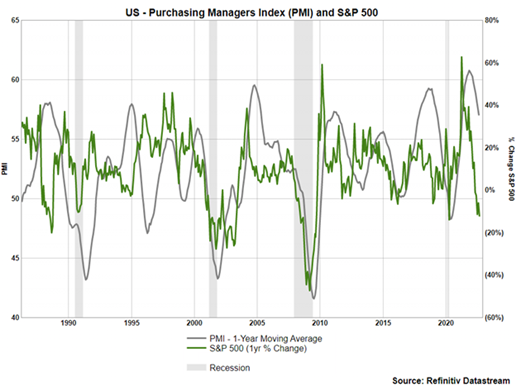
Updated Chart

Market Update Mar 31 – Market Fundamentals Narrowing the Gap on Price
In the March 31st market update, we talked about the fundamentals backing the advancement in the S&P 500 over the past few years. Forward earnings (light blue line) drive asset prices, as they represent the core fundamentals of a business. In this particular market update, we highlighted that the market has been compressing towards its fundamentals (forward earnings). It is unclear exactly where forward earnings will go next, whether they continue to grow at its recent pace, or if they begin to flatline/decline, but one thing is clear, is that the rise in asset prices that we saw since 2020 was driven by strong corporate earnings.
In the updated chart, we can see that the market has continued to narrow the gap between price and earnings, and earnings have continued to rise. This is both encouraging that earnings have persisted to grow and valuations are becoming more attractive for investors.
March 31st Chart

Updated Chart

Market Update Feb 15 – US Inflation
In the February 15th market update, we talked about broad market weakness being linked to inflation. In February, US inflation was quite apparent, and had recently hit the level of 7.5%. Broad market weakness was being attributed to worries of rising interest rates and the impacts of quantitative tightening, but the underlying issue was inflation. To analyze the demand aspect of inflation, we looked at the connection between consumer expenditures (consumption) and consumer savings, and noted that throughout the pandemic, there was a mirroring effect between consumers’ savings and spending. Savings rose rapidly in 2020 as spending nosedived, however, in the years following, expenditures rose rapidly and savings began to fall.
Expenditures rising likely led to and contributed to the high inflation that we see today, however, in the updated chart we can see that savings have fallen dramatically further since, and consumer spending has pivoted lower. We suspect these trends in falling savings and consumption will continue to strengthen the case for falling inflation in the coming year.
February 15th Chart
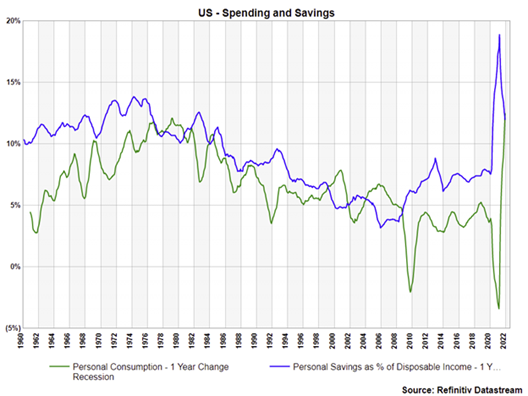
Updated Chart

Conclusion
As we head into the New Year and fresh narratives and macro developments unfold, we reflect on the historic year that we have been through, and how usually, these challenging times are often the greatest teachers. Even though it has been a tough year for the markets and most portfolios are down for the year, the silver lining is that we hope members have gained more knowledge, have been able to navigate these tough waters, and can move onwards and upwards with increased wisdom.
‘Wisdom comes alone through suffering’ – Auchelysis

Best wishes for your investing!
www.5iresearch.ca