If you're familiar with my work, you know I'm a huge proponent of momentum investing. For those of you who don't know, momentum investing is a strategy where the objective is to profit from the continuation of trends.
The term "trend is your friend" derives from the theory that stocks trending in one direction will continue to go much higher than assumed possible. In other words, great companies with a proven track record tend to continue to perform well. The difficulty with this investment strategy is emotions because people have trouble buying stocks breaking out to new highs. This psychological barrier becomes troublesome as many investors avoid these breakouts. One way to help mitigate some of this emotion is to use logarithmic scale charts.
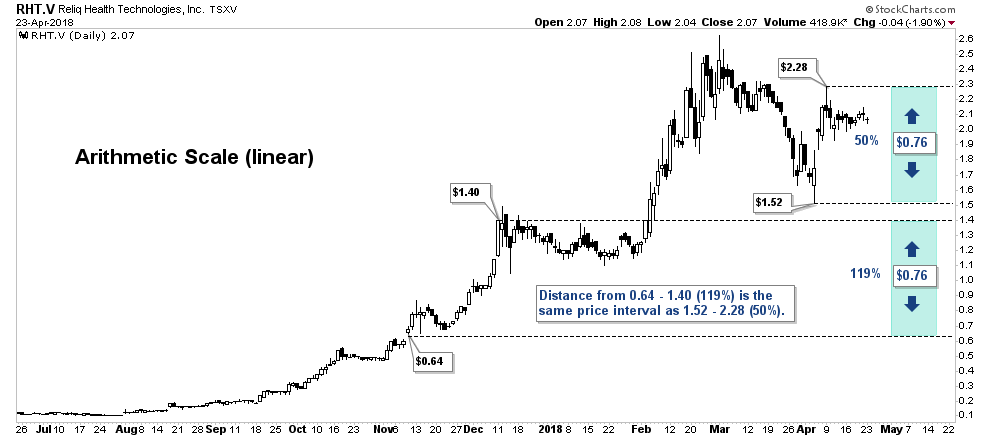
The difference between a logarithmic (log) and arithmetic (linear) chart scale can be seen on the vertical or y-axis. The vertical axis on a linear scale chart shows the price units measured in the same price intervals. The distance of a change between $1 to $2 would be the same as the plot distance from $10 to $11.
Arithmetic Scale (Linear)
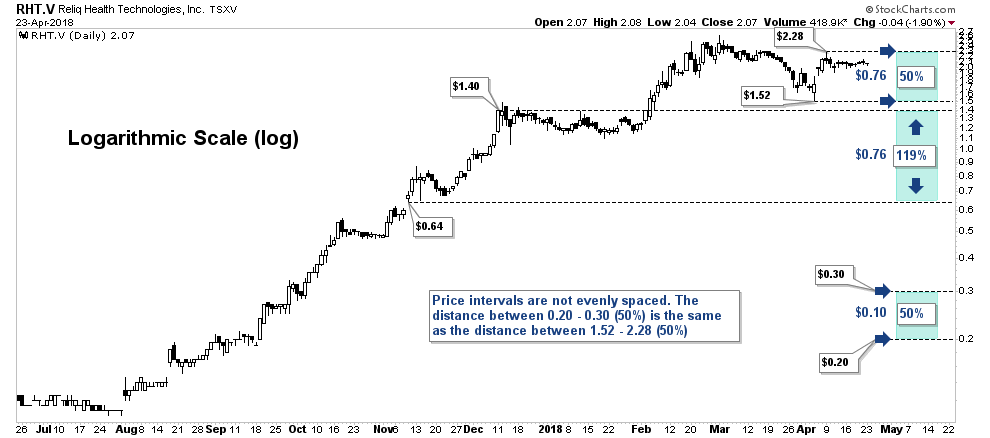
Where the log scale chart represents the same percentage change in price. The distance between $10 to $11 or $100 to $110 will always represent a 10% increase in price rather than a particular dollar amount as on the linear scale chart.
Logarithmic Scale (Log)

Traders looking to capture short-term price movement may prefer linear scale charts. The problem with linear scale is when zoomed out to view long-term price history it can make the chart look parabolic or scary to retail investors. Commonly, when a security's price range over the period being studied is greater than 20%, a log scale chart should be used. Long-term charts consisting of more than a few years should also be plotted on the log scale. This becomes even more important when charting growth stocks. Log scale can help investors visualize a nice consistent uptrend while softening chart volatility which in turn helps take out emotion.
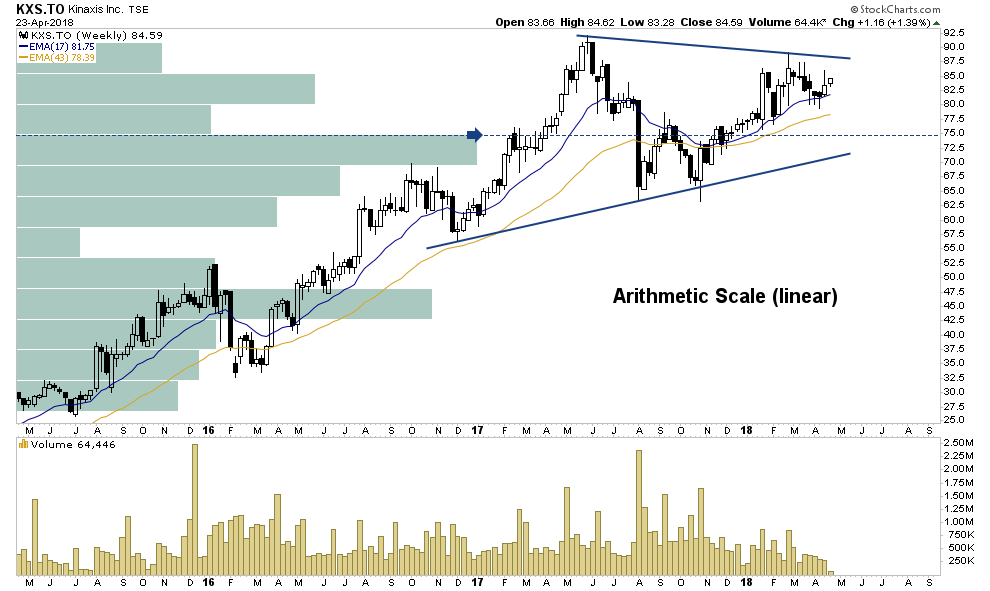
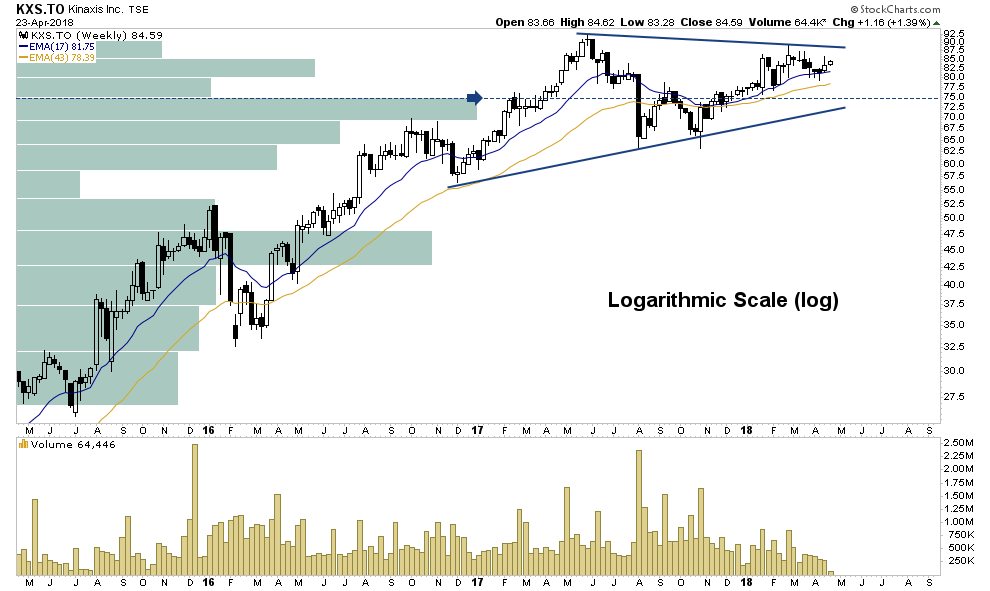
Kinaxis (TSX:KXS) is a prime example of a volatile growth stock. I first blogged about Kinaxis back in December when price action started to breakout above $75 giving a momentum alert buy signal. Since, price action has worked its way 12% higher and continues to be poised for higher prices. Although that 12% wasn't a smooth ride. When comparing the two charts below, it becomes obvious where the log scale chart can remove the appearance of volatility (emotion) and can help an investor stick with a trade.
Kinaxis - Arithmetic Scale

Kinaxis - Logarithmic Scale 
This blog idea was an excellent suggestion from one of our members. No better way to conclude than with their quote, "It can be very instructive to look at a stock chart using a log scale. Great companies tend to have long-term track records that are very linear up to the right when looked at using a log scale but look scary parabolic when looked at with a linear graph.
Only looking at the linear stock chart, which I think most retail investors focus on, may scare investors away from buying a great company, whereas looking at a log scale shows just how steady and consistent the stock growth has been over a long period of time and therefore removes a psychological barrier to getting into a great company. Suggest encouraging your readers to look at a long-term log scale graph during their due diligence process of stock selection, especially with growth stocks."
Have a question? Sign up for free to ask 5i's Research Team your top question, plus get instant access to Canada's top stocks, three model portfolios, and over 62,000 answered investments questions. Get your free 5i Research Trial here.
By Dwight Galusha from SetYourStop.com
Disclosure: The author does not own the stock mentioned.
Nothing in this article should be deemed as a recommendation to buy or sell securities and is for informational purposes only. Please do your own due diligence before making an investment decision.


Comments
Login to post a comment.