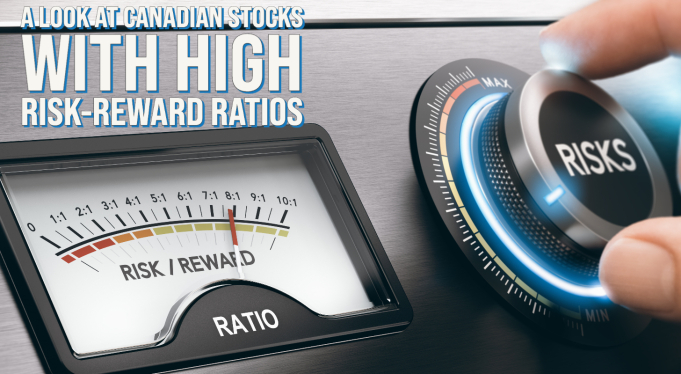
There are two main factors to consider when looking at an investment portfolio – risk and return. It is an investor’s job to analyze where their risk tolerances lie and what type of return they are looking to achieve, and to ensure that these two values align. It is a fundamental principle in investing that a higher return is almost always associated with higher risk. It is the nature of the beast that investments which carry high returns also have higher risk, which in this case means volatility.
Canadian Stocks - Sharpe Ratio Screener
In this blog, we have run a screener on Canadian stocks with the highest risk-reward ratio (also known as Sharpe Ratio) over the past 20 years. The screener analyzes the average annual return and annual volatility of each stock, takes into account the current risk-free rate of 5%, and generates which stocks have provided investors with the highest rate of return per unit of risk. For those interested, the formula is: (annual rate of return – risk-free rate) / (annual volatility). Below we have highlighted the top 50 Canadian stocks out of a total ~360 names with the highest risk-reward ratios over the past 20 years (ranked from highest to lowest). Members may recognize some of these names from our model portfolios or coverage list, including CSU, DOL, FSV, TSU, DCBO, DSG, and others.

Source: 5i Research, Yahoo Finance
Risk and Return Map
As we mentioned earlier, the risk-reward ratio takes into account two factors; returns and risk. What the above table is identifying is which stocks have historically provided investors with the optimal mix between returns and risk, regardless if the annual returns were, for example 25% or 5%. In contrast, the graph below identifies of those stocks from our list above, where they lie along the ‘risk curve’, meaning, where do their respective annual returns and annual risk levels lie relative to each other.
This is essentially what is referred to as the ‘risk-curve’ visualized. On the bottom axis is the level of risk that each stock has, and on the left axis is the level of annual return that each stock has provided over the past 20 years. As we can see, typically the stocks with the highest levels of returns (up) also have the highest levels of risk (right). If an investor has a lower risk tolerance, stocks closer to the left-side of the graph have exhibited lower risk levels, but also have generally provided lower levels of returns. On the other hand, an investor with a high risk tolerance can look for stocks farther out to the right side of the graph, which can vary in levels of annual returns, but can also provide investors with good opportunities for relatively high rates of returns.

Source: 5i Research, Yahoo Finance
We have zoomed in on the graph where the bulk of the names lie, so that readers can get a better sense of individual stock names and levels of risk to return.

Source: 5i Research, Yahoo Finance
Where the analysis becomes interesting is in looking at names with the same volatility levels (for example CSU and PBH both have roughly a 0.25 annualized volatility), but CSU has provided a much higher average annual rate of return than PBH. This analysis basically determines for the same level of risk, an investor has the potential to earn a higher rate of return with CSU as opposed to PBH. Of course, this is backward-looking, and nothing is guaranteed into the future, but for those companies with a long history, this analysis takes into account 20 years of data. Performing this analysis also does not factor in one’s sector exposure and geographic exposure, all of which are important elements in the portfolio management process.
Key Takeaways
Overall, this is a great exercise in determining one’s risk tolerance levels, and whether their aspirations for investment returns are in-line with their comfortability with risk. We would not place too much emphasis on switching allocations based on this analysis, but rather use it as a framework for interesting Canadian stock names and what levels of volatility to expect for each name.
Research for Today, Invest for Tomorrow.

Twitter: @5iChris


Comments
Login to post a comment.