Many investors use a defined list of criteria to evaluate a company’s prospects. A stock screen generates an investable universe of companies that demonstrate these qualities of interest. This month’s 5i Filter (and the next few going forward) highlights some of the things that pique our interest in potential investments.
The first stock screen we will highlight is momentum. The filter below shows stocks that trade on the TSX with a market-cap of at least $100 million and have hit 52-week price highs while paying a 1.0% dividend yield.
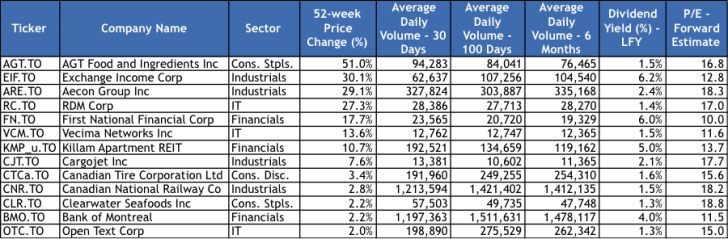
We have ranked results by the return over the 52-week period. A higher return increases the chance the stock has been strong over the entire period and is not just recovering from a previous trough. An example of this latter point would be BMO. The stock hit a 52-week high after surging roughly 14% in the past three months; however, the nine months previous saw the stock fall 12%.
What is better than price momentum? Price momentum with corresponding volume strength. High volume coupled with rising prices can indicate that traders are increasingly placing their long-term confidence in the stock. We have shown volume over three different time periods – 1, 3 and 6 months. An increasingly higher volume over shorter time intervals is certainly a strong momentum indicator, as is seen in the case of AGT.
We have also filtered for stocks trading at a P/E less than 20x the next 12-months earnings. At 5i Research, we are not concerned with paying a higher valuation for a great company. However, with momentum you want to ensure you are not buying into an over-hyped stock. For example, the reader may notice an absence of material stocks. While many in the sector are hitting 52-week highs, some trade at expensive valuations, as earnings have not followed the degree of price appreciation.
Momentum is a powerful tool for investors as studies has shown that there is an ability for this type of strategy to outperform over longer periods and it also shows that someone, somewhere, is willing to purchase a stock at the highest level it has been at for some time and that they still believe in the future return potential regardless of recent gains.


Comments
Login to post a comment.