
New Report
We have initiated coverage on Andlauer Healthcare Group (AND). This is a relatively new company to the market with a longstanding history of transportation and logistics for the Canadian healthcare sector. Industry tailwinds, expanding profit margins, and an experienced management team. We like the future prospects on this one.
Read the latest updates by logging in here!
Market Update
Markets were flat for a little while and have most recently jumped up to all-time highs again as fears of inflation begin to subside. Consumer inflation numbers were mostly in line with expectations, which was news that was positively met by investors as the idea of transitory inflation becomes more of a possibility. Positive quarterly earnings results are demonstrating the strength and robustness of the economy and the continued momentum from the depths of the 2020 lows. As some market uncertainties are being resolved, and others are still lingering, we look to an interesting development that is occurring in the correlation between stocks and bonds.

The chart above examines the historical correlation between stocks (S&P 500 ETF) and bonds (20+ Year Treasury Bond ETF) over the past 15 years. To get an understanding of how the correlation works, a correlation of -1.0 is perfectly negatively correlated, meaning that as one asset rises, the other falls by the same proportion. A correlation of +1.0 is perfectly correlated and indicates that both assets move in the same direction together (both up and down). Traditionally, stocks and bonds have exhibited a negative correlation, which provides an investor diversifying effects. Although, we have observed four instances over the past 15 years where the correlation between stocks and bonds briefly turns positive, meaning that they are moving in the same direction. These periods in time signal to us that investors had no clear strategy and were buying or selling both assets simultaneously.
Looking back through history we can observe why this market anomaly has occurred and the results all lead to the same underlying theme; a period in time where multiple uncertainties led investors to be completely risk-off (sell both stocks and bonds) or buy both assets out of uncertainty of the direction of interest rates. Let’s take a further look into each period, what those multiple uncertainties were, and how the market reacted afterward.
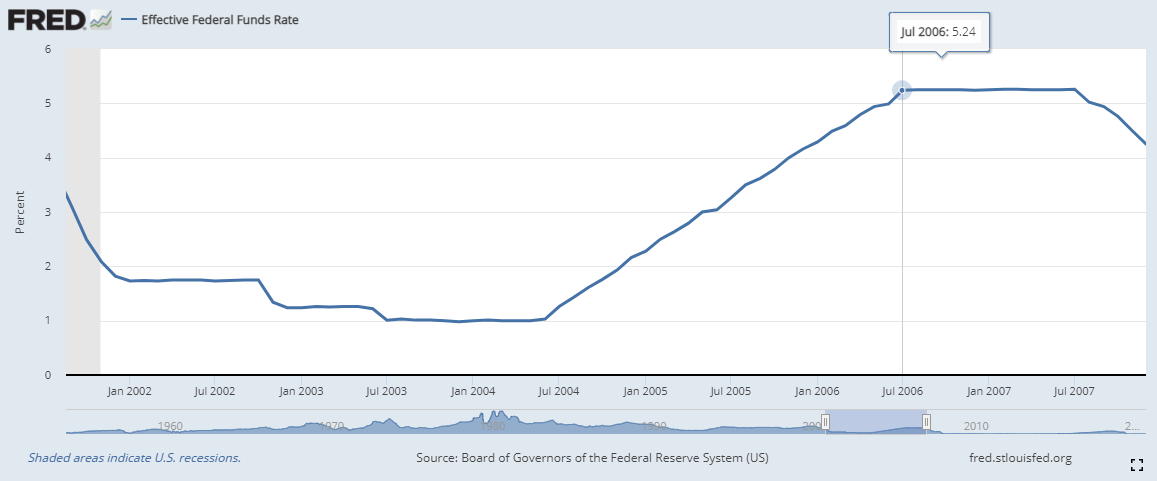
May to December 2006
First, let’s review the uncertainties in the market at this time; there were fears of inflation as the CPI spiked in April 2006, interest rates increased 17 consecutive times, and the Federal Reserve Chair, Ben Bernanke, had just come into office in February 2006. This particular period of positive correlation between stocks and bonds was spurred by fears of the Federal Reserve continuing to increase interest rates to quell inflation at the risk of stalling economic growth. Both assets rose as a Fed meeting in June suggested further rate hikes might be off the table, causing investors to be unsure whether to buy bonds or stocks. It wasn’t until the Fed officially paused rate hikes in August 2006 and CPI numbers moderated in late 2006 that the correlation between the two assets turned negative again. The Federal Reserve paused and even decreased interest rates for 2007, and inflation subsided, which caused stocks to increase throughout 2007 while bonds were sold off.
October to December 2013
During this time, the uncertainties in the market were whether the Federal Reserve would taper its bond-buying program, who was to be named the new Fed Chair, and worries over a partial government shutdown over a budget debate. This period of brief positive correlation was caused by simultaneous sideways movement by both stocks and bonds, until December 2013 when Ben Bernanke announced that the central bank would begin to taper its bond-buying program and Janet Yellen was named the new Fed Chair. The partial government shutdown lasted until late October. Once these three uncertainties were resolved, stocks sold off and bonds carried higher, causing the correlation to dip negative again.
November to December 2016
The uncertainties at this time were the upcoming presidential election and whether interest rates would begin increasing again after a pause in rate hikes during 2016. Both stocks and bonds fell going into this period of time as investors sought safety in anticipation of the upcoming election. Once the election was announced in November, bonds sold off and stocks rallied, causing the correlation to head lower. Then, in December, Janet Yellen announced the first rate hike since late 2015, and bonds found a bottom, and markets continued higher.
April to June 2021
The most recent period of positive correlation entails uncertainties of inflation, potential tapering, and talks of advancing interest rate hikes due to inflation. Stocks and bonds both experienced sideways action during this time as inflation numbers came in much higher than expected and worries of advancing interest rate hikes to 2023 started. The recent inflation data in August has suggested cooler inflation than originally anticipated. This has eased a lot of fears around inflation and implies that interest rate hikes could be pushed back out. The onset of resolving these uncertainties has caused the correlation to dip back into the negative territory, and we would expect this trend to continue into the remainder of the year.
Conclusion
So, with these historical data points and resolved uncertainties in mind, we do believe the market is beginning to climb the wall of worry and move to the other side. With the stocks and bonds correlation beginning to move back into the negative territory, has the market told us that fears of inflation and advanced interest rate hikes are over? We believe yes, and this to us signals a potential risk-on mode into the remaining half of the year.