As I get closer to my chartered designation, I find myself being more interested in behavioral finance (psychology). When investors hear the term technical analysis they often think of lines and patterns on a stock chart. I've even heard skeptics call it voodoo. Although, many are not aware that the driving force behind the lines and patterns is crowd psychology. A stock chart is nothing more than a picture of human emotions. The term 'price has memory' comes from the fact that support and resistance areas are created by human emotion and psychology. Not only is psychology important for understanding a stock chart, but it's very important for understanding our own manifestations and helps us to block out the unnecessary market noise. The hardest part is developing awareness. Once aware investors are able to mitigate the effects of their own biases while taking advantage of the herd behavior.
Today I'm going to focus on a few aspects of market psychology that every retail investor should know. But, first, we have to be able to distinguish between the two types of behavioral biases: cognitive and emotional. To simplify the classifications, a cognitive error can be defined as an information processing error (statistical and/or memory). It is often the result of faulty reasoning. Many times an investor will "think" they are using a rational process in their decision making but fail due to these errors. Once identified, cognitive errors can be easily fixed through better information and/or education. I'll give more examples throughout the blog, but one cognitive bias I see every day in the financial world is called anchoring bias or the anchoring effect. Anchoring bias can be defined as "relying too heavily on an initial piece of information offered when making decisions". With this bias investors will often place too much weight on a magic threshold. As an example, the 200-day moving average. Many investors will not buy a stock unless it's above the 200-day moving average. Thus, identifying it as some kind of a magical resistance line rather than performing the appropriate calculations based on actual price action. The media also loves hyping up these magical thresholds. For example, if the S&P 500 continues to climb back toward the all-time high, I can guarantee the phase "S&P 500 - $3000" will be repeated until our ears bleed.
Conversely, emotional biases are much harder to correct because they stem from impulse and/or intuition. Often an investor needs to first recognize these issues, then find a way to minimize the effects.
Two different cognitive errors demonstrated above are conservatism bias and cognitive dissonance bias. The conservatism bias is the tendency to give too little weight to new information (the short report), therefore people fail to modify their prior beliefs as much as the new information would warrant. Cognitive dissonance bias occurs when newly acquired information conflicts with preexisting understandings. People will go to great lengths to defend their view despite new information (It happens in the uranium and gold sectors as well).
Below I go over the behavioral elements associated with market trends and the psychological forces that drive them. The following ideas were learned from, The Handbook of Technical Analysis + Test Bank: The Practitioner's Comprehensive Guide to Technical Analysis by Mark Andrew Lim. The book is a must-read for anyone interested in technical analysis.
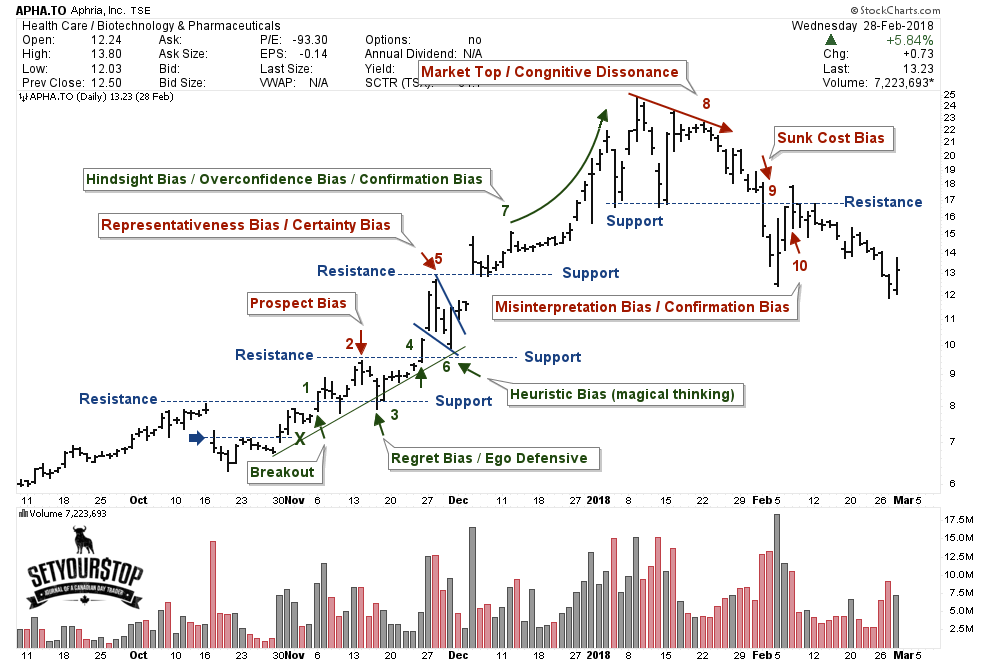
Point 2 on the chart: In many situations, price does not persist but whipsaws investors with a throwback to the breakout level. This behavioral bias can be attributed to investors being less reluctant to gamble with profits than with losses. This type of behavior can be described by the prospect theory or certainty bias (label at point 5 on the chart). Traders are happy to lock in small profits rather than the uncertainty (gamble) of securing a larger one.
Point 3 on the chart: Traders that failed to go long at 1 are filled with regret (regret bias). They don't want to miss out again so they buy on the pullback to 3. Another group of trades who went long at X and sold at the first resistance level are also feeling regret so they also buy the pullback. Then yet another group of traders who bought at point 2 buy even more as the price retraces and finds support at point 3 to prove they weren't wrong. This behavior combined with prospect bias explains why an uptrend is made of peaks and troughs (vice versa in a downtrend). It also helps explain why resistance turns into support.
Point 4 on the chart: This process repeats at points 4, 5, 6, and so on up the trend.
Point 5 on the chart: As the trend unfolds, it starts to become more obvious. This representation frames the mind (representativeness bias). More traders who are confident they would've bought and sold the dips (hindsight bias) jump onboard, overestimating their abilities.
Point 6 on the chart: Take note of the trendline drawn through points X, 3, and 6. Traders have a tendency to buy obvious trendline support. This is known as a heuristic bias (or magical thinking). Heuristic represents a simple guideline. Many traders will act without understanding. Another learned response.
Point 7 on the chart: Traders frustrated and filled with regret for not participating in the trend can clearly identify it in hindsight (hindsight bias). The regret fuels more buying. Traders who where lucky enough participate in the trend become overconfident (overconfidence bias) and place too much faith in their abilities. This leads to the underestimating risk and overestimating expected returns which also fuels more buying. Confirmation bias also begins to play a bigger role in pushing price higher. This phase of the trend is not based on research or sound advice but rather on mimicking others (FOMO).
Point 8, 9 & 10 on the chart: The greatest amount of cognitive dissonance is experienced during a market top (or trend reversal). During times of dissonance, traders will often do anything they can to reduce this discomfort that conflicts their view. Often they will simply ignore and hope for a rebound (loss-aversion bias), selectively expose themselves to information that only confirms their view (confirmation bias), misinterpret information to make it conform to their view (misrepresentation bias), be ego defensive and buy even more (sunk-cost bias), or blame others (self-attribution bias).
Have a question? Sign up for free to ask 5i's Research Team your top question, plus get instant access to Canada's top stocks, three model portfolios, and over 75,369 answered investments questions. Get your free 5i Research Trial here.


Comments
Login to post a comment.