
New Report
We have posted a new report on AcuityAds Holdings (AT). The company uses data analytics, machine learning, and artificial intelligence to allow advertisers to connect with their audiences. It has recently launched a product where advertisers can purchase ads through a real-time auction as their audiences load media onto their electronic devices. The thesis for the company is aided by industry tailwinds, rapid growth, and a currently low valuation. We believe there could be a lot of adoption to occur on the company's advertising network, and that this name has a long runway ahead.
Read the latest updates by logging in here!
Report Update
We have posted a report update on Enbridge (ENB). The company is a substantial player in the North American energy sector, and its share price has been supported by the improving energy sector outlook. The company has strong cash flows, improving gross profit margins, and offers a good dividend.
Read the latest updates by logging in here!
Market Update
Financial markets continued to slide over the past couple of weeks, although we are beginning to see signs of the sell-off easing. The Federal Reserve and Bank of Canada concluded their meetings and released the minutes last Wednesday. Both Central Banks stated that no immediate rate hikes will take place, however, rate hikes are certainly on the table come the end of Q1 and beginning of Q2. The Federal Reserve is expected to end its bond-buying program by March, although the timeline for a run-off or selling off its purchased bonds is yet to be determined. These hawkish stances by the BoC and the Federal Reserve are amid persistently high inflation, well above the 2% target. Following the central bank meetings, news of the US economy’s growth rate came in and showcased a robust reading of 6.9%. Below we dive deeper into the GDP reading and what this means for the markets.
Q4 2021 US GDP Growth Rate
The annual US GDP growth rate for Q4 2021 was recently publicized, and the numbers are quite impressive. The US saw a 6.9% annual real GDP growth rate in Q4 2021, and this led to a full-year 5.5% annualized growth rate for 2021. Those are great numbers on an annualized basis, and it is something that we want to dive deeper into. Most of the GDP gains in Q4 came from four major categories: private inventory investments, exports, personal consumption expenditures (PCE), and nonresidential fixed investments. Below we are going to briefly touch on each of these categories:
Increase in Private Inventory Investment:
The majority of the Q4 2021 growth in GDP was led by an increase in private inventory levels. Inventory levels contributed 4.9% to the year-over-year GDP growth number in Q4, and most of it was through retail and wholesale trade industries. The key driver within the retail industry was a substantial increase in inventories by motor vehicle dealers. Inventory building up can indicate both increasing demand and potentially some easing in the supply chain bottlenecks.
Increase in Exports:
Exports were another substantial contributor to the Q4 growth figures, contributing 2.43% of the 6.9% growth rate for the quarter. Most of the exports’ contribution was through goods, led by consumer goods, industrial supplies and materials, foods, feeds, and beverages. Services exports were led by travel. Increased exports is a net positive for the US economy and leads to a strengthening in the US dollar.
Increase in PCE:
Personal consumption expenditures contributed 2.12% to GDP growth, mostly through the services sectors (healthcare, recreation, and transportation). An increase in PCE can be a proxy for consumer sentiment - PCE increase indicates increased consumer optimism.
Increase in Nonresidential Fixed Investment:
This segment's contributions were mostly through an increase in intellectual property, software investment to be specific, and this contributed 0.53% to the quarterly GDP growth rate. Business spend on software can be a leading indicator for which sectors and segments may be leading in economic growth.
US Real GDP Per Capita
One of the better metrics of assessing GDP growth is through the Real GDP per Capita metric. This reviews the GDP levels per capita for the US and thus takes into account population growth. As we can see in the chart below, US GDP per capita has been on a steady ‘up and to the right’ trend dating back to the 1940s. The time periods highlighted in grey indicate US recessions, and right away it is quite noticeable that the 2020 recession was one of the more deep and short-lived recessions in US history.
Reviewing the long-term trend of US GDP growth is useful in assessing the economic fundamentals that underpin the US financial markets. While there may be periods of months to years that demonstrate negative GDP growth or flat to declining stock markets, on a long-term basis, the US economy has shown incredible resiliency and strength.

In the table below we have analyzed the length of time that it took the US economy to recover its GDP level for each recession dating back to 1948. There have been roughly 11 recorded recessions in US history since the late 1940’s, and the average length until GDP levels recovered was 2.3 years. The Global Financial Crisis marked the longest stretch of time until GDP levels recovered their recent highs, spanning a total of 5.3 years until full GDP recovery. The most recent recession in 2020 took a total of 1.5 years to recover its recent GDP high, and this is in line with the shortest recessions in history - being 1960 and 2001. The 2020 recession recovered its GDP levels 55% faster than the average recession.

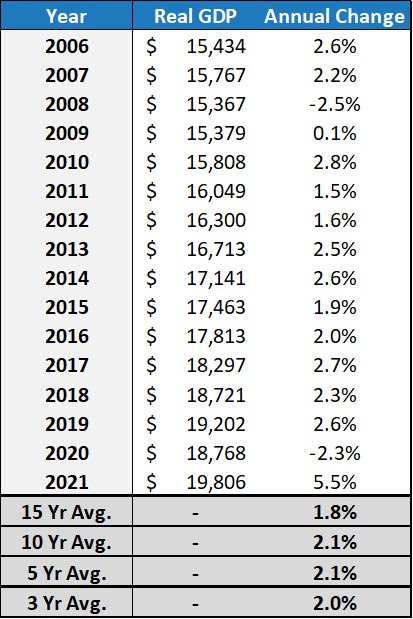
Annual Real GDP Growth Rates
We also figured it would be prudent to review the annual real GDP growth rates (not factoring in per capita) to put into context the latest 5.5% reading. A healthy annual GDP growth rate is loosely defined as being in the 2% to 3% range, whereby, less than 2% indicates a slowing economy, and greater than 3% on average indicates an economy that may be overheating. We can see that over the past 3-, 5-, 10-, and 15-year periods, the average annual GDP growth rate has been between 1.8% and 2.1%. We would consider this to be quite healthy, and in fact, on a longer-term basis, the US GDP has grown at an annualized 3% rate since 1948.
Key Takeaway
As an investor, it is incredibly easy to get caught up in shorter timeframe narratives. These shorter timeframes can make us feel as though the markets and economy are either crumbling or rising too quickly, however, when we zoom out and look at the grander picture, all appears in-line and on course. During rapid sell-offs, like the one that we have been seeing over the past few months, it is important to focus on the big picture and not get swept up by shorter timeframe volatility in the market. The recent recession in 2020 was one of the steeper declines compared to prior recessions, but it was also one of the quicker rebounds. When reviewing the annual GDP growth rate over even the past three years, we can see that the average growth rate has been 2.0%. This signals to us that the economy is correctly on track, and fundamentally, the US remains a strong and dominant global economic force.
Model Portfolio Changes
Balanced Equity Model Portfolio
Trim Aritzia (ATZ) by 1.0%
Trade Rationale - With the position weight nearing 8% of the portfolio, we believe it is a good time to trim to reduce portfolio risk. Shares are up 9% this month after more than doubling since last year, so the timing also looks appropriate to do so. Of course, we are still optimistic about ATZ's long-term growth trajectory and believe there is plenty of room for shares to run.
Best wishes for your investing!
www.5iresearch.ca


Comments
Login to post a comment.