
5i Research - YouTube
At 5i Research, we have started creating short videos on our YouTube channel to educate investors about our services and interesting investment topics. We aim to increase the number of videos that we produce over time, and the topics will range from tutorials, market updates, top questions of the month, and more.
Check out the 5i Research YouTube page today to learn more about our services that you may not already know, or find interesting investing content!
Report Updates
We have posted report updates on AcuityAds Holdings (AT) and Parkland Corp (PKI). AT operates as a technology platform that connects advertising purchasers to their target audiences across video, mobile, and social media channels. PKI is an international fuel distributor and retailer that provides individuals with essential fuels, convenience items, and quality foods. One company has seen intense competition, and secular tailwinds, while the other has demonstrated its unique competitive advantage. We have upgraded our rating on one of these names.
Read the latest updates by logging in here!
Dropping Company Coverage
We are dropping coverage on Enthusiast Gaming (EGLX). Over the past year, a lot of macro uncertainties along with a negative change in the company's financials have altered our investment thesis on the company. Given its negative operating results, we feel that the path to profitability now becomes much longer than expected. We believe there are other attractive opportunities in the market, and due to its deterioration and weakening outlook, we are dropping coverage.
Read the latest updates by logging in here!
Investor Sentiment Survey - RESULTS!
Thank you to all those that participated in this past market update's Investor Sentiment Survey. We have published the results from the survey in a report in the link below. Please note that the weightings and categorization of these results are still a work in progress, and the model(s) used to analyze the results may change over time as more data comes in.
This marks an important sentiment survey results thread, as the results have flipped bullish for the first time since launching the survey in July 2022! Investor sentiment is just barely bullish overall, reaching a little over 50/100, as more respondents feel positive about the Canadian stock market than negative, and forward expectations are largely bullish. For reference, the lowest survey reading was 18/100 in October, when the TSX was ~10% lower than where it is today. The majority of members continue to feel that three years is likely for the markets to make new highs, but an increasing number of investors feel 'bullish' or 'very bullish' on the markets.
Survey Results
We look forward to releasing another round of the Investor Sentiment Survey at the next market update!
Market Update
The markets have been moving higher over the past couple of weeks as inflation data has been coming in line with or below expectations across both the Canadian and US markets. It has been a period where 'bad news is good news' as certain economic data points have suggested faster deterioration in parts of the economy, hinting at continued slowing inflation. In early April, oil made an overnight leap from the mid-$70s to the low $80s as OPEC announced its plan to cut production. Earnings season is underway, and so far results from the financial sector have largely been positive. In this market update, we look at past returns from the small-, mid-, and large-cap spaces, and the average forward returns following a large drawdown.
Detach Emotions from Fundamentals
There are many sayings about the financial markets that refer to its volatility and uncertainty, such as ‘the market can stay irrational longer than an investor can stay solvent’ or ‘buy when others are fearful and sell when others are greedy’, but all these really point to is that the market is cyclical in its nature. For all the uncertainty about the markets, one thing is certain, it will ebb and flow alongside investor’s psychology and it will often swing by extreme levels as investor’s grapple with their emotions. An investor that can not only identify these emotions in others but also that can detach emotions from the fundamentals and intrinsic values of a company can benefit from these cyclical periods.
Historical Annual Returns of Large-Cap, Mid-Cap, and Small-Cap Stocks
In this market update, we want to analyze the price performance of US large-cap (LC), mid-cap (MC), and small-cap (SC) stocks since 2000 and the typical returns that follow a 20%+ drawdown. This past year we saw 20%+ drawdowns in the large-cap and SMID-cap (small/mid-caps) names. For large-cap stocks we are using the S&P 500 index, for mid-caps we use the S&P MidCap 400 index, and for small-caps the S&P SmallCap 600 Growth index. Small-caps saw a 20%+ year-over-year decline in June of 2022, both small and mid-caps in September of 2022, and large and small-caps throughout October to December of 2022. The below chart on rolling annual returns highlights these facts, but also demonstrates the close proximity in annual returns across all asset sizes.
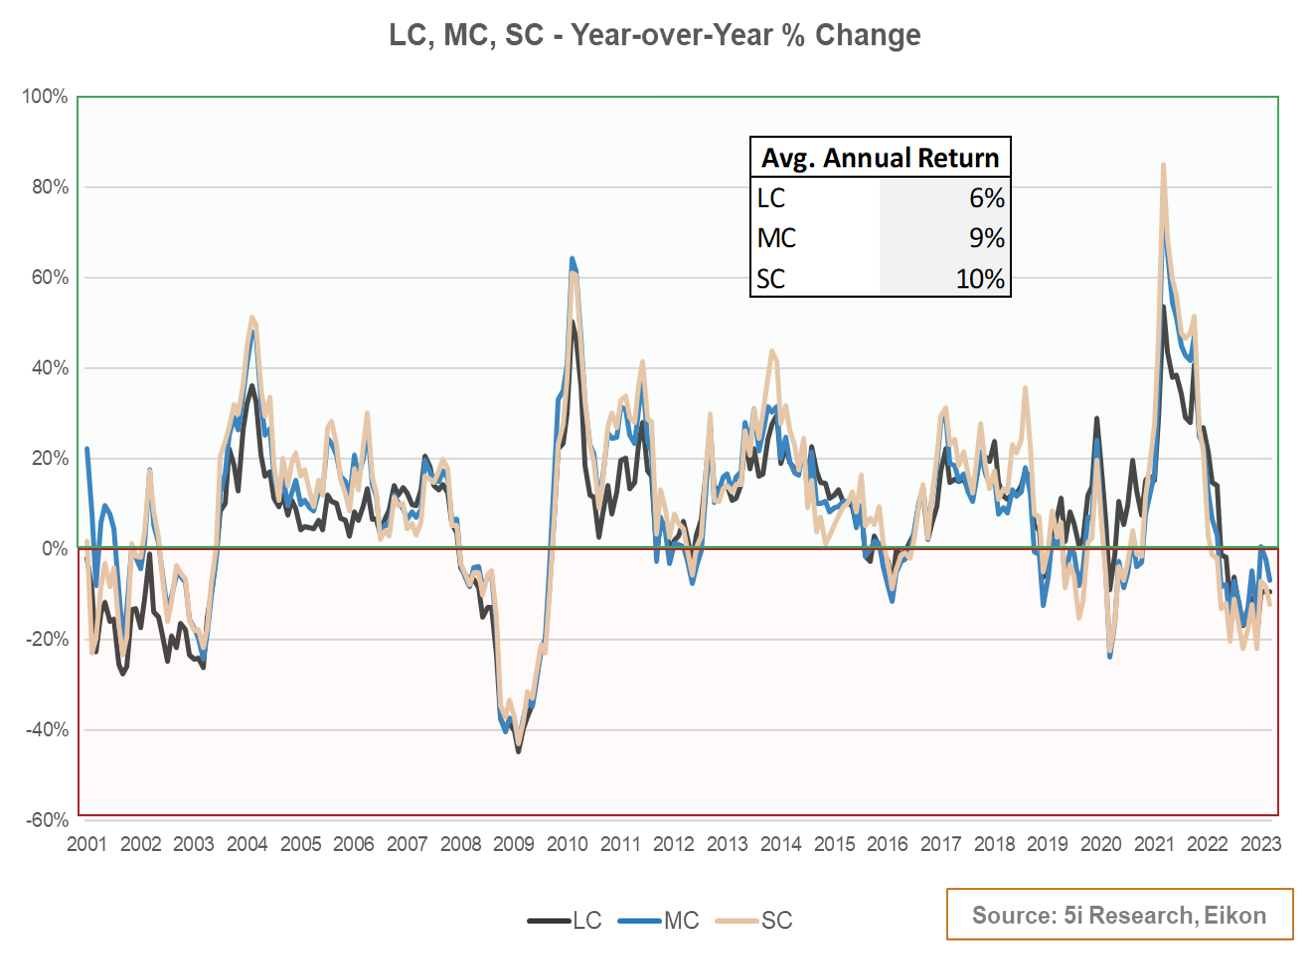
Figure 1
Forward One-Year Returns Following a 20%+ Decline
From the chart above, we can see that there have not been too many instances of 20%+ drawdowns over the past 20+ years, and in fact, there have only been four major instances (2000-2003, 2009, 2020, and 2022). We have decided to plot all forward one-year returns for the three asset sizes following a 20%+ drawdown since 2000. We feel that the results are quite impressive. Over the past 23 years, the one-year return following a 20%+ drawdown averages 18% for large-caps, 44% for mid-caps, and 37% for small-caps. We can see in the chart below that the forward one-year returns are largely skewed to the upside for SMID-caps, whereas large-caps have a more muted one-year return. The higher the dot is on the graph, the better the forward one-year return is following a 20%+ decline. The worse the decline, the better the forward returns are.

Figure 2
Forward Three-Year Returns Following a 20%+ Decline
Stretched out on a longer timeframe, the results are even more compelling. The forward three-year returns following a 20%+ decline in the indexes have resulted in purely positive results for SMID-caps, while the large-caps faced only a few negative three-year forward returns. On an average basis, SMID-caps returned 76% on a three-year forward basis, and large-caps 39%. These are quite the encouraging stats for an investor with a timeframe greater than three years, which is quite a low threshold to begin with.
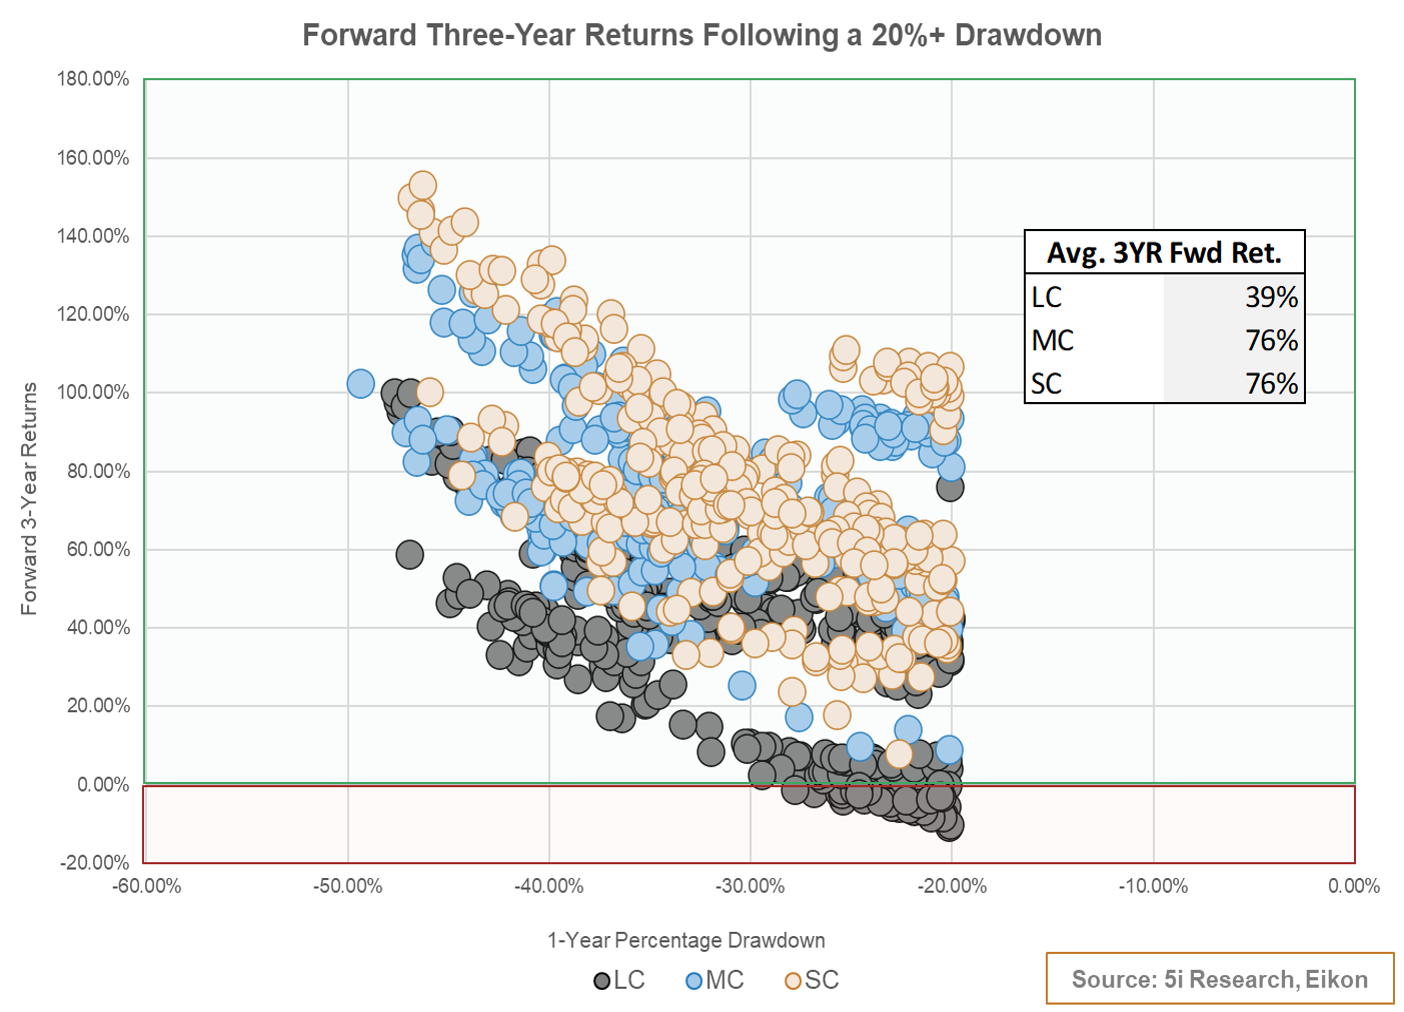
Figure 3
Since the latest 20%+ annual decline instance for each of the three respective indexes, large-caps (Dec 2022) have since increased by 7%, mid-caps (Sep 2022) by 11%, and small-caps (Dec 2022) have remained flat. Using the average forward one-year returns from Figure 2, this would give SMID-caps a good runway for the remainder of the year and large-caps a less positive, but still historically strong runway for returns.
Just as investor psyche ebbs and flows, so too do asset prices and valuations, and it is typically in times of peak fear and uncertainty that the greatest opportunity lies. Using daily historical data over the past 23 years we have demonstrated that negative forward returns are few and far between following a 20%+ decline, and that SMID-caps have skewed upside potential in the eventual upswing of a new bull market.
Best wishes for your investing!
www.5iresearch.ca